Process Mining
- My contribution
- Prototype: https://tinyurl.com/2t9z388b
- Team
- 2× Product Designer, 1× Product Manager, 3× Engineers
- Year
- 2025
How could we make sense of complex data mining visualisations
Prototyping and Optimising Process Mining Visualisations
Research Problem
1. Process mining do not explicitly prioritise visualisation (Gschwandtner, 2017) 3. Complex visualisations and limited interactivity 4. E-learning platforms issues include unfamiliarity with advanced features, navigation issues and poor designs (Abuhlfaia & De Quincey, 2019)
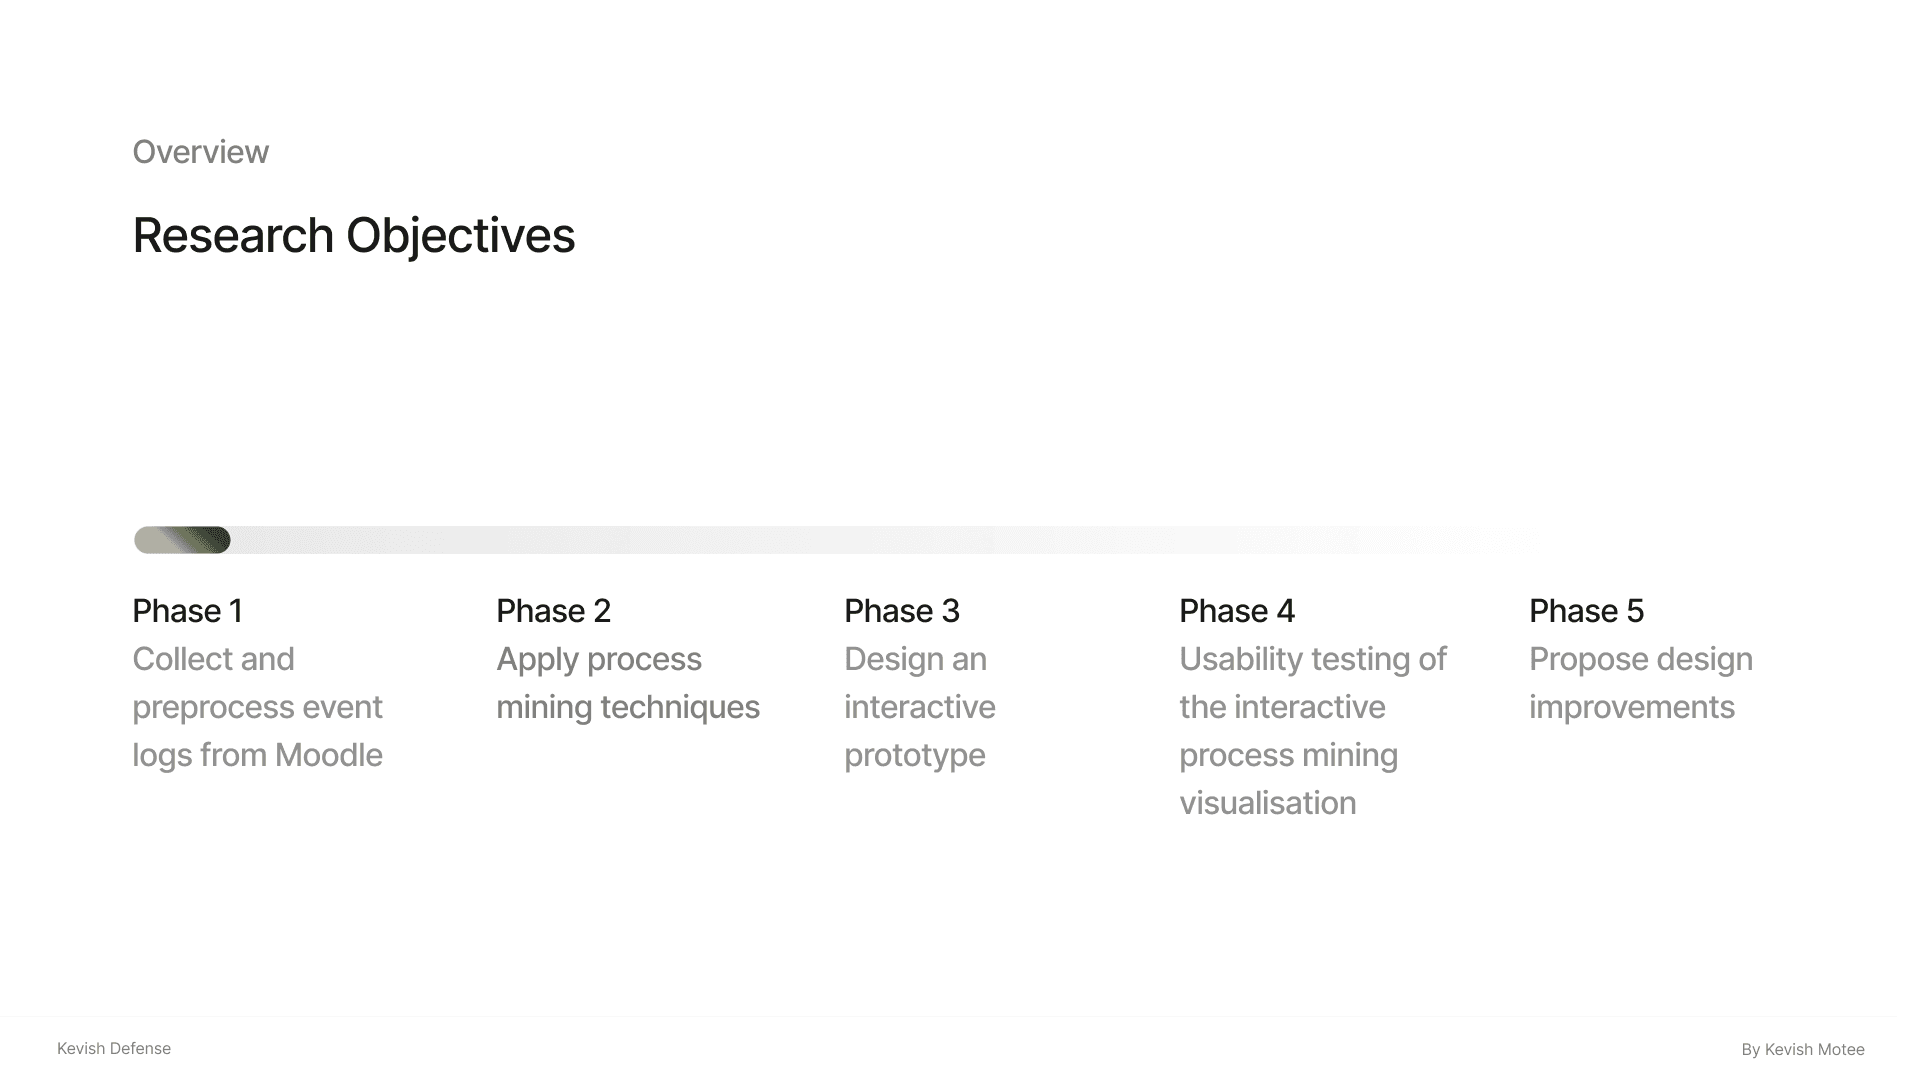
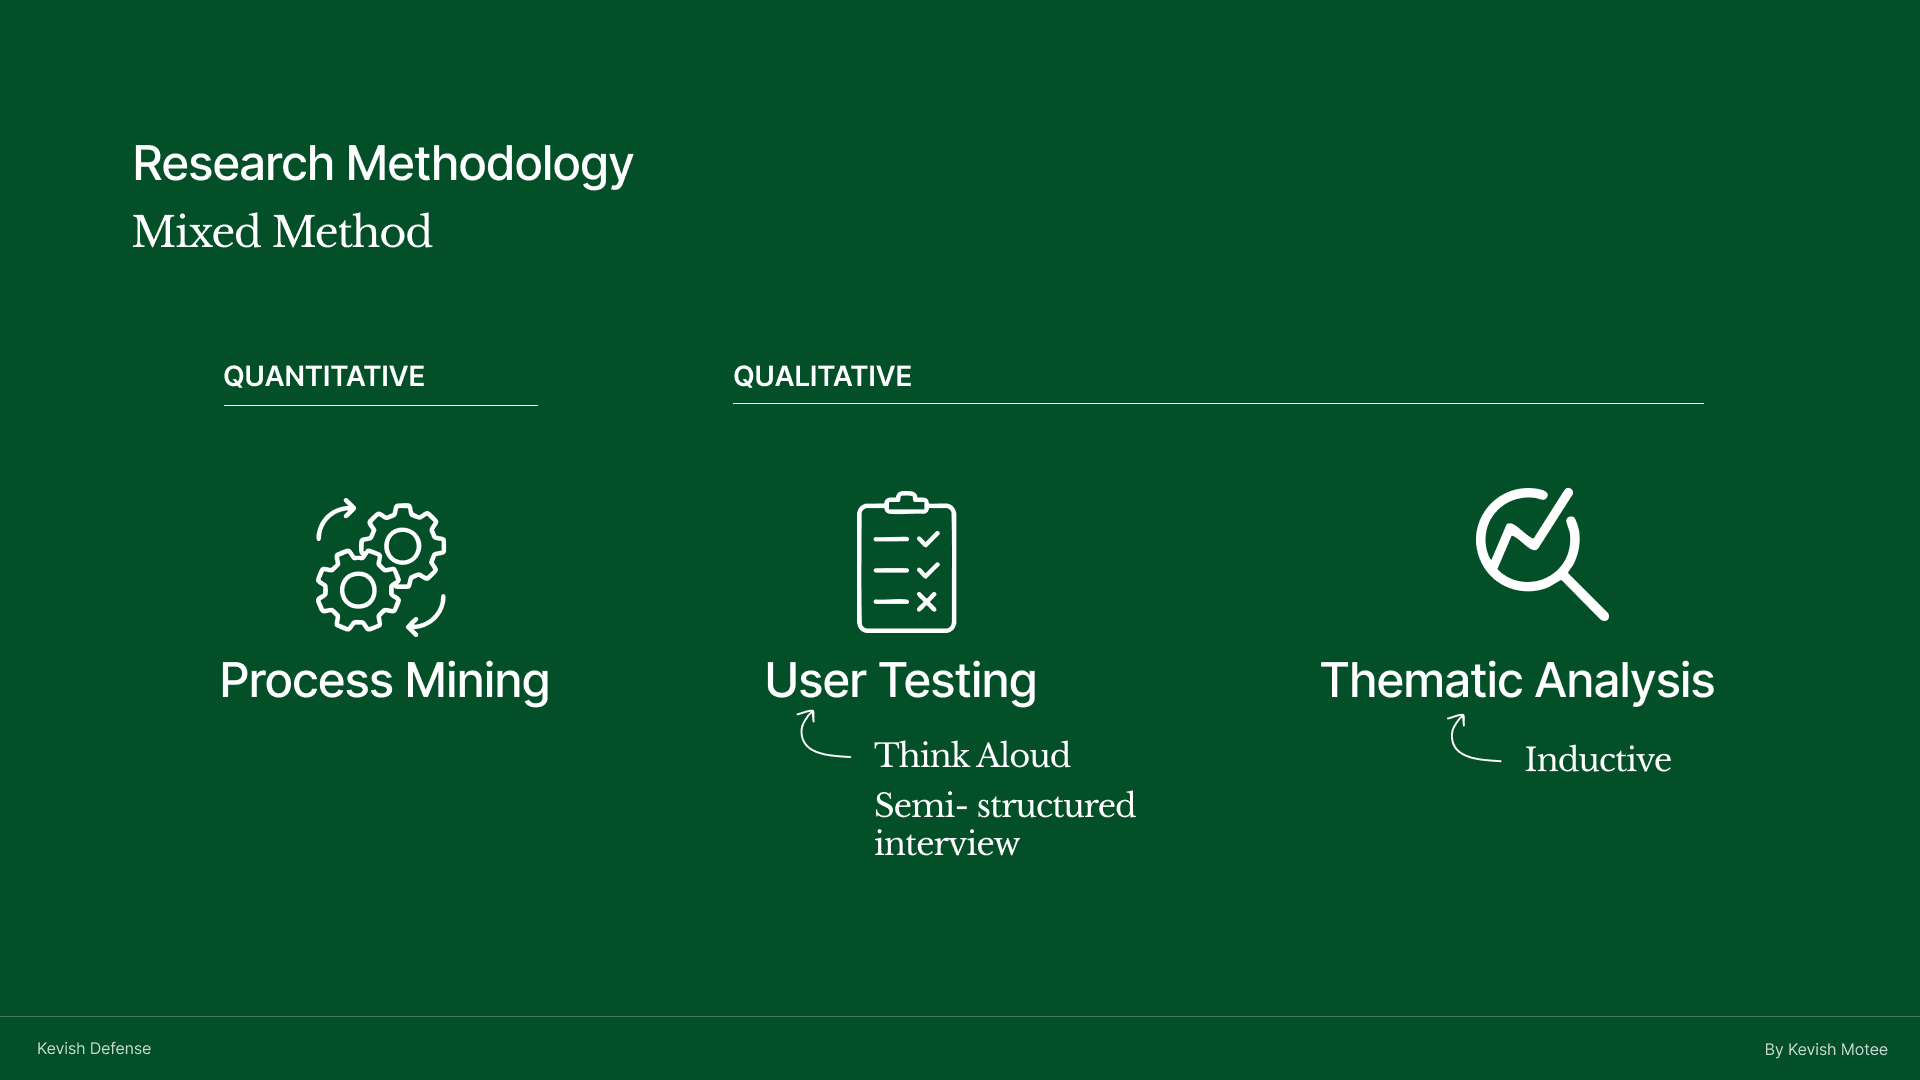
Research Methodology
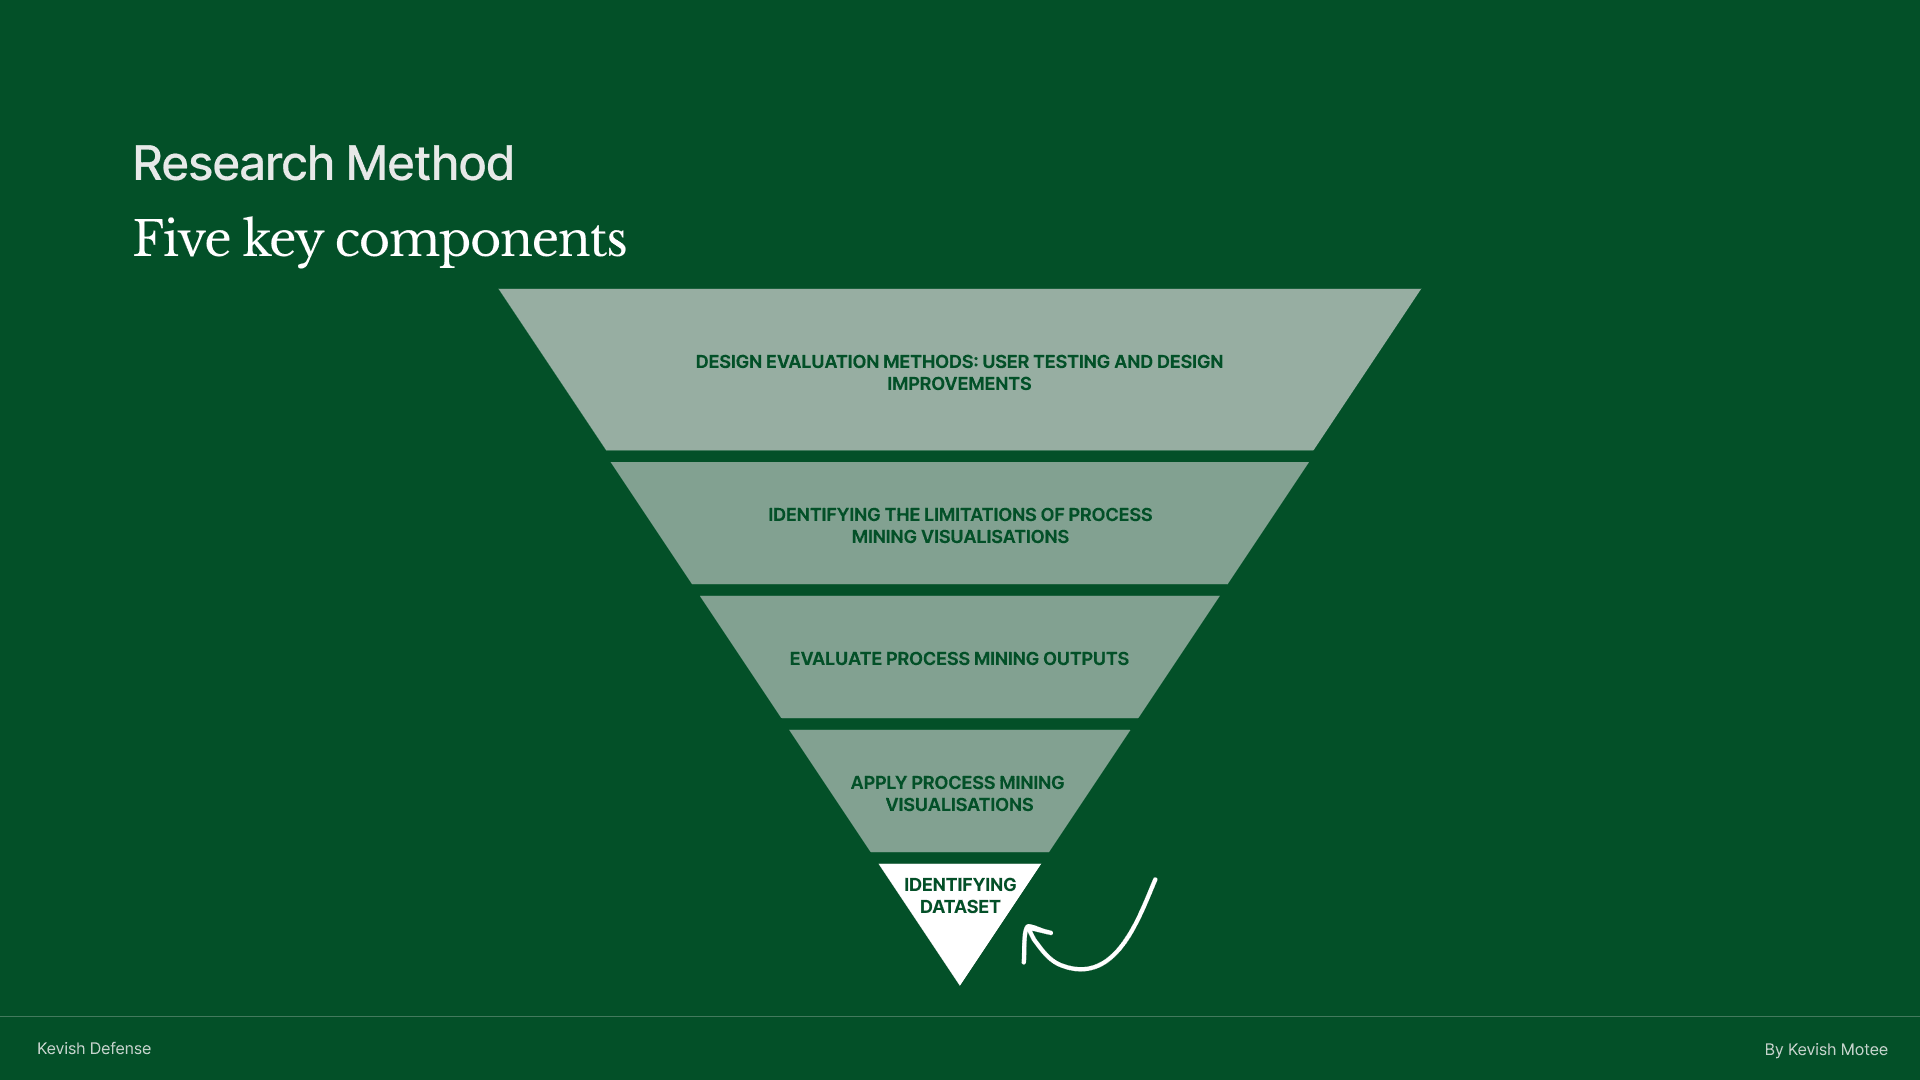
Components
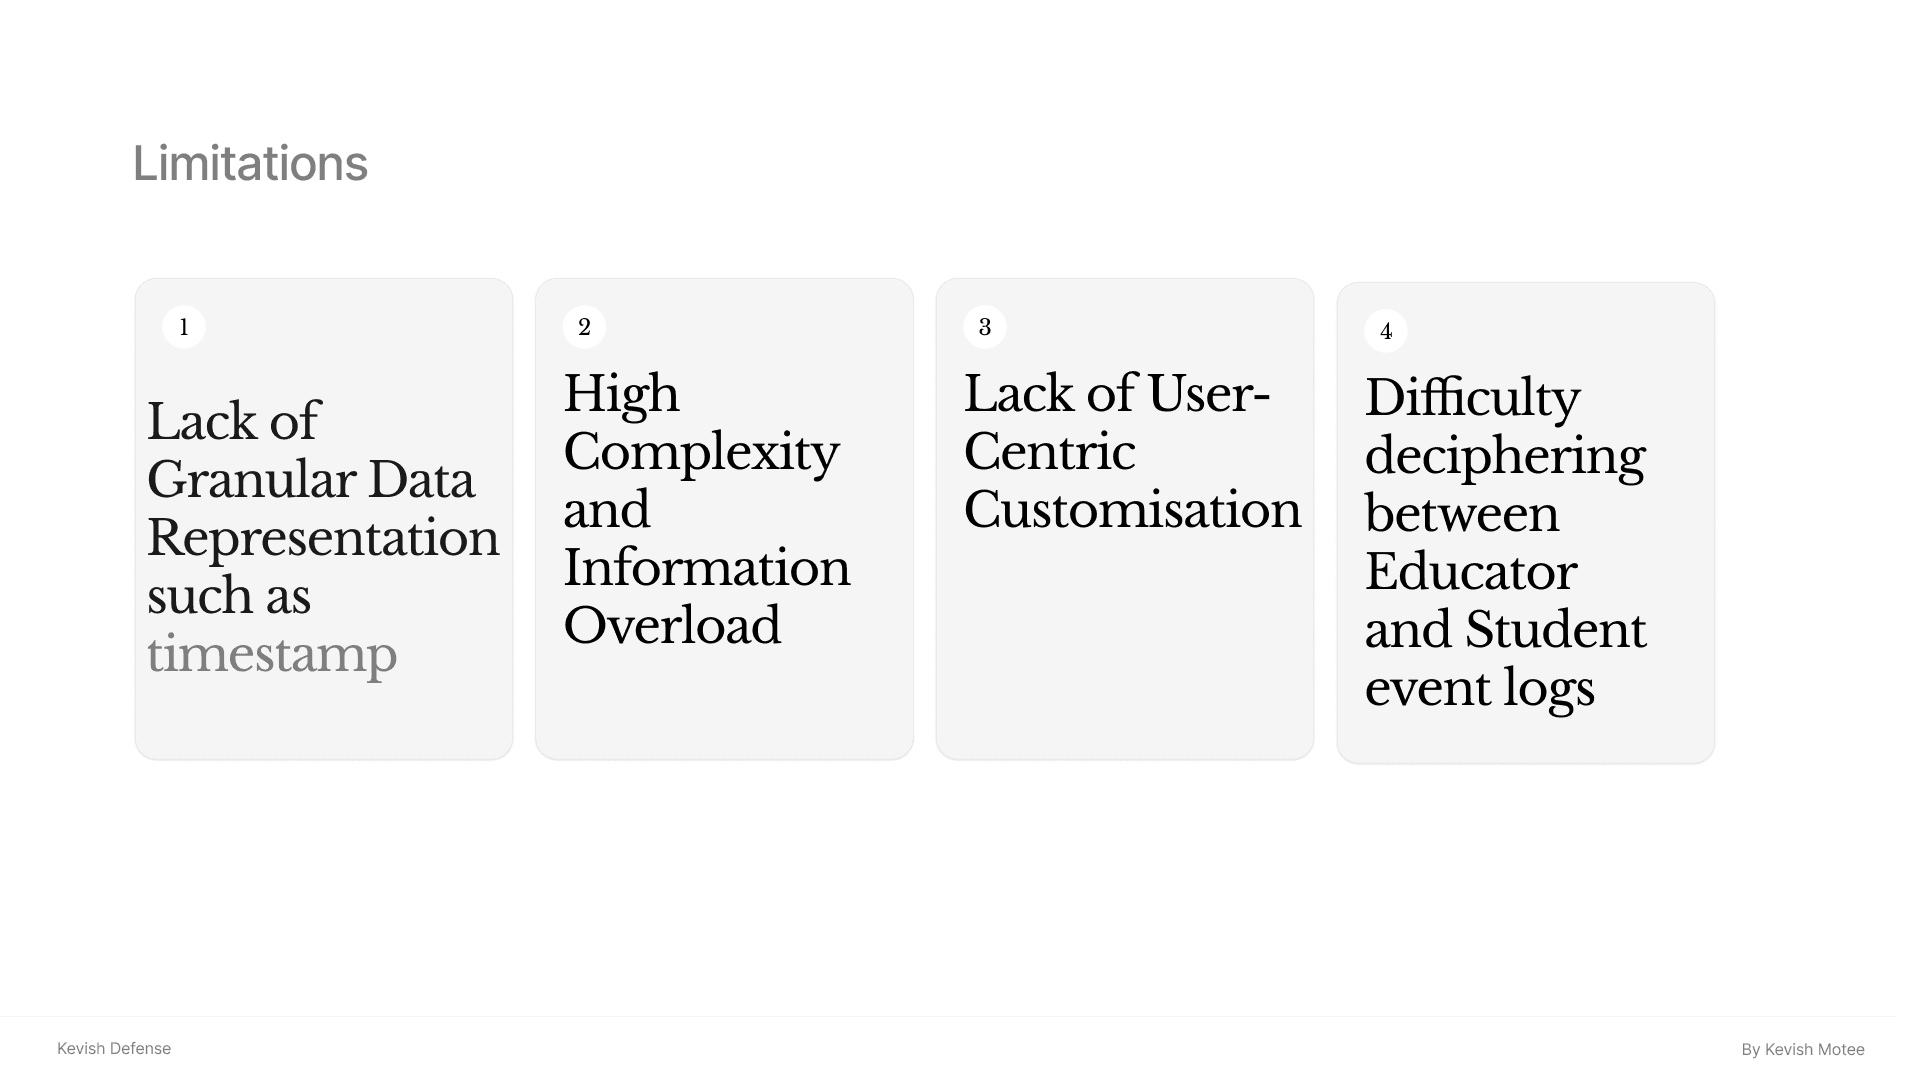
Limitation of Current Process Mining
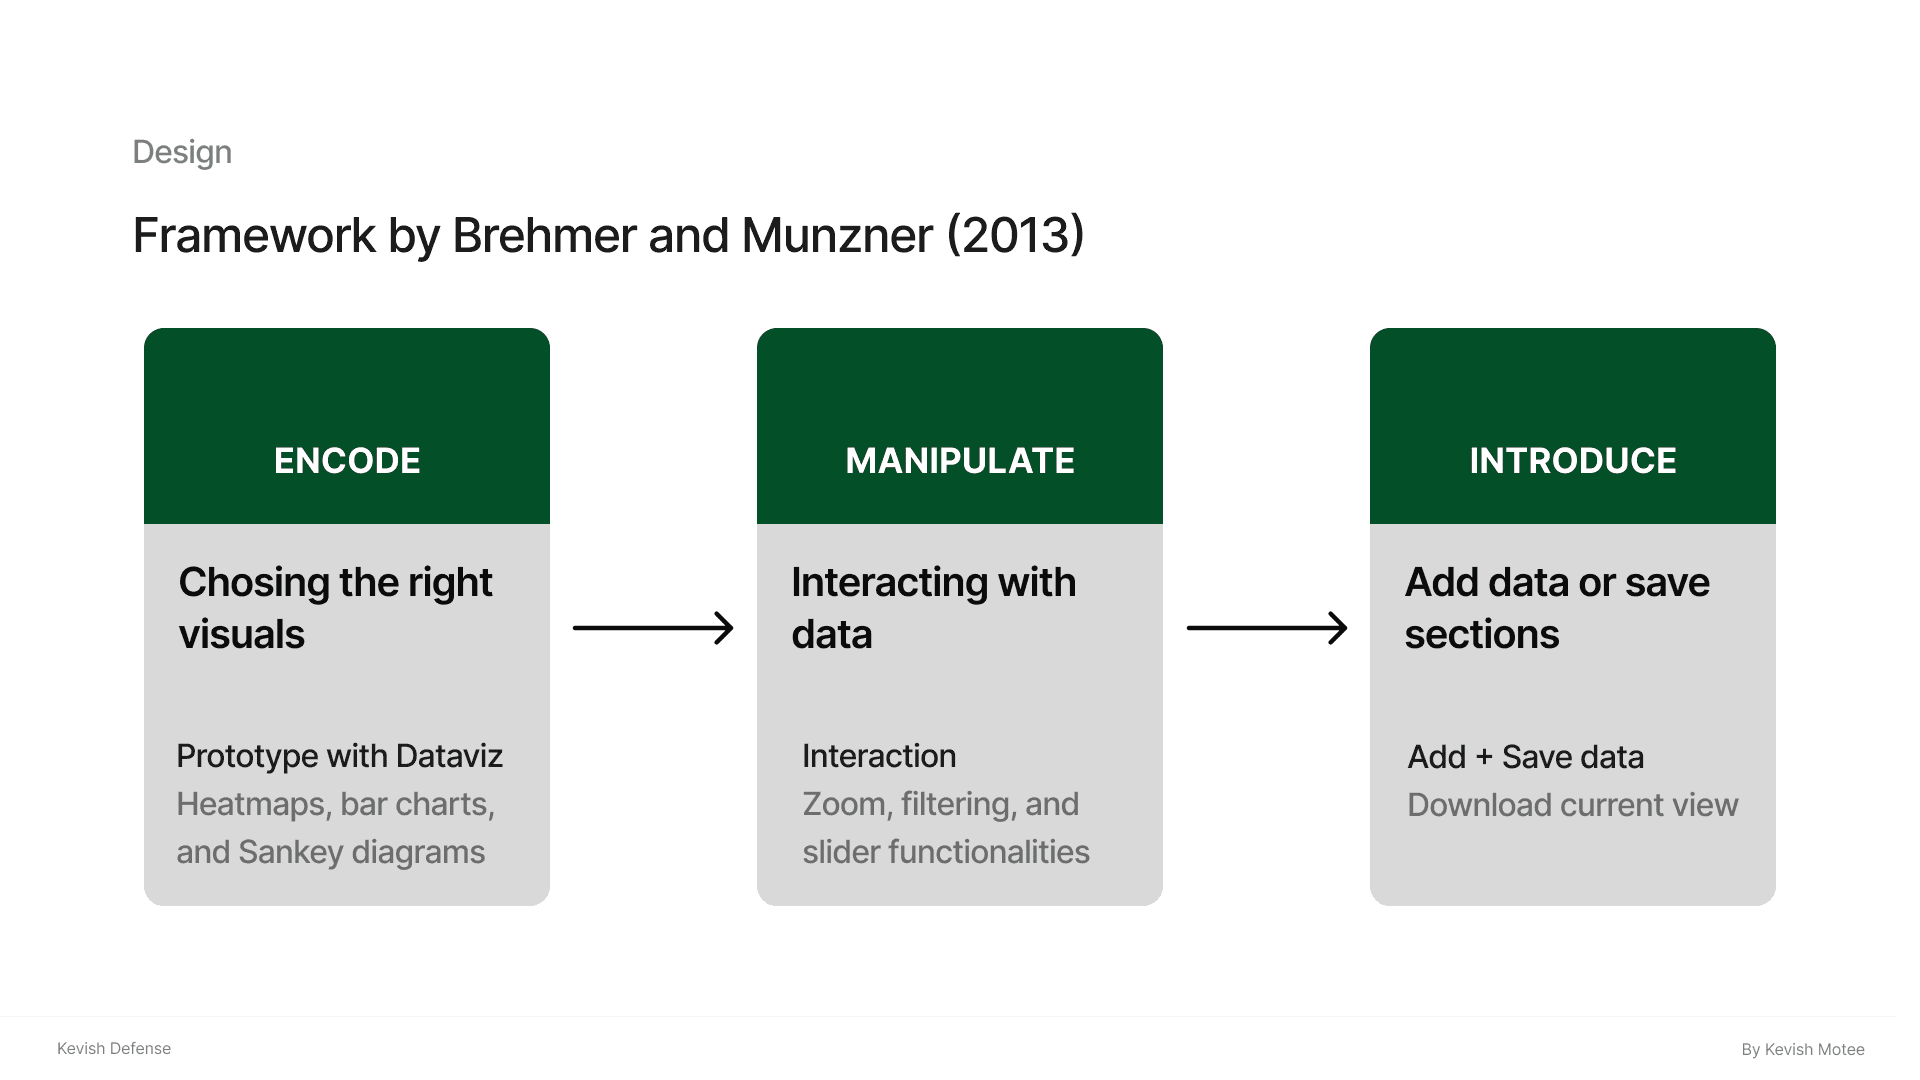
FRAMEWORK
PROTOTYPE
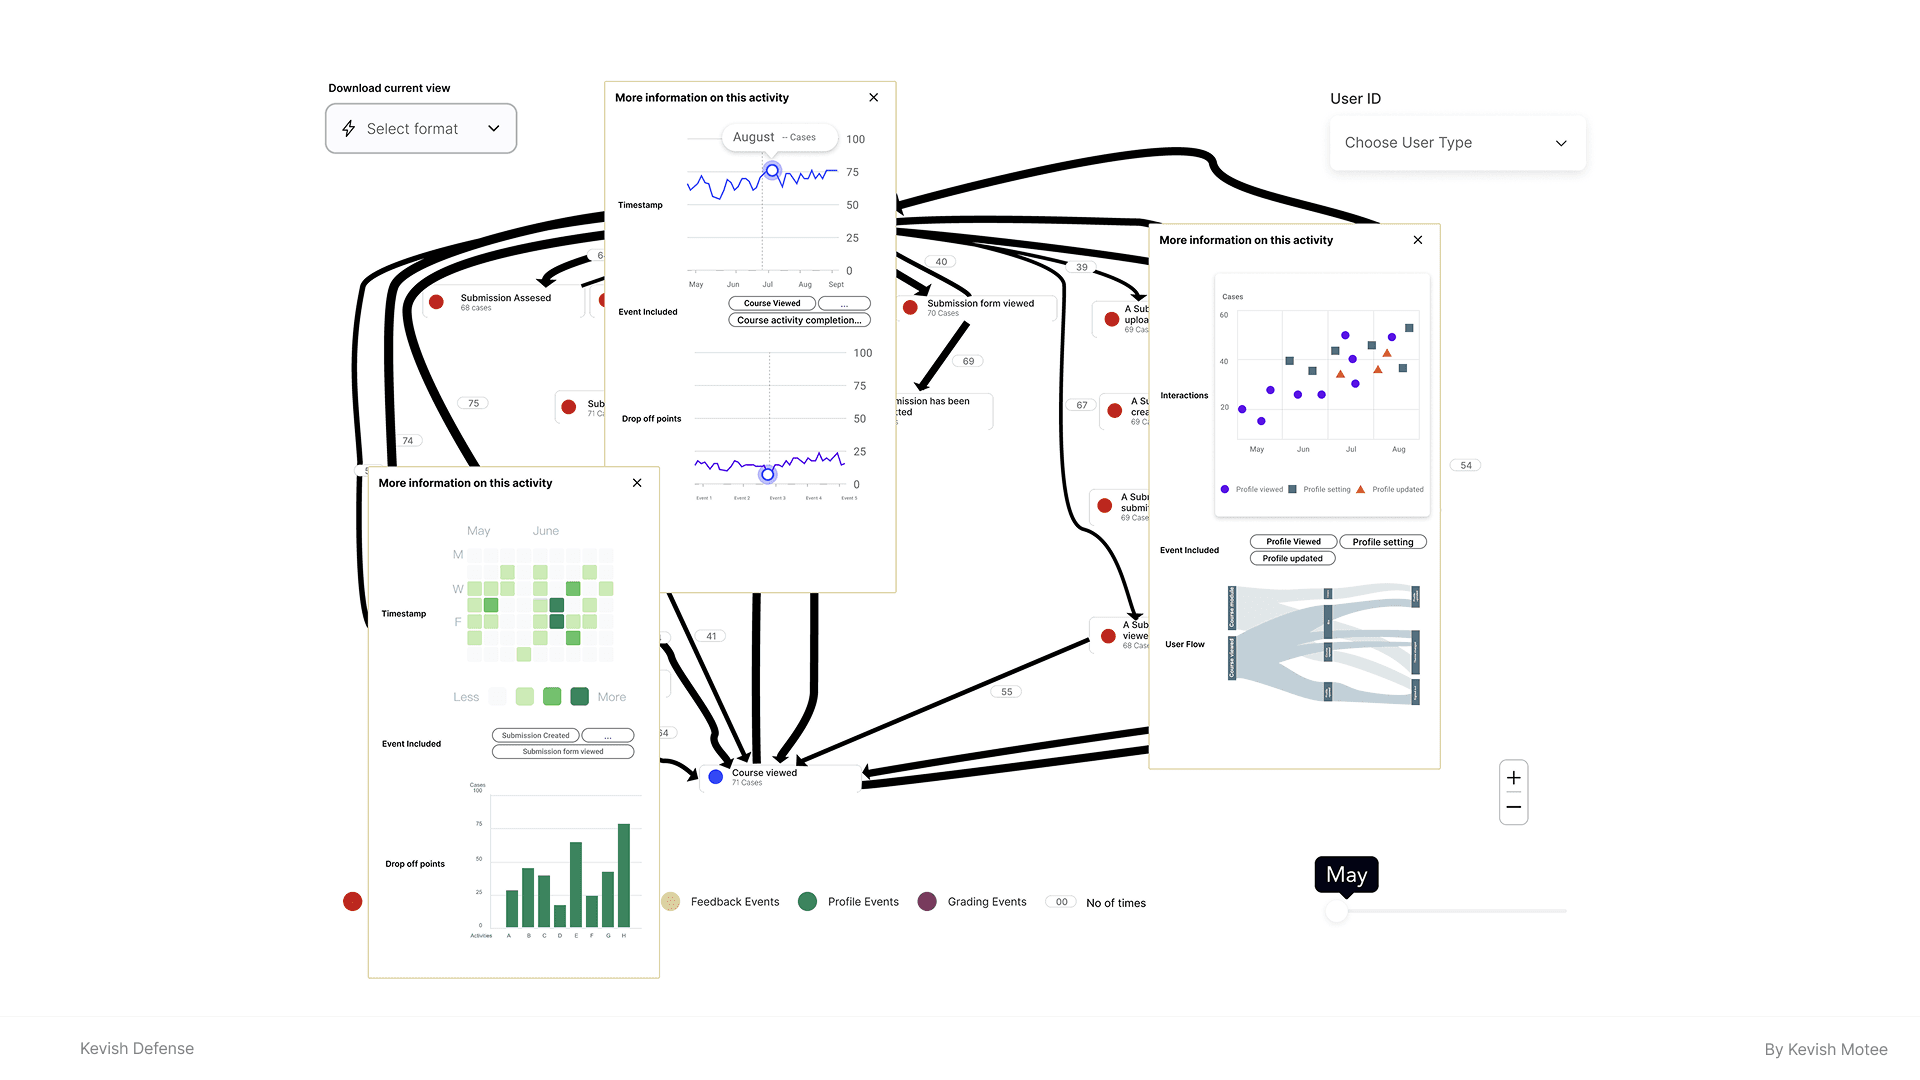
A. Click-Based Interaction
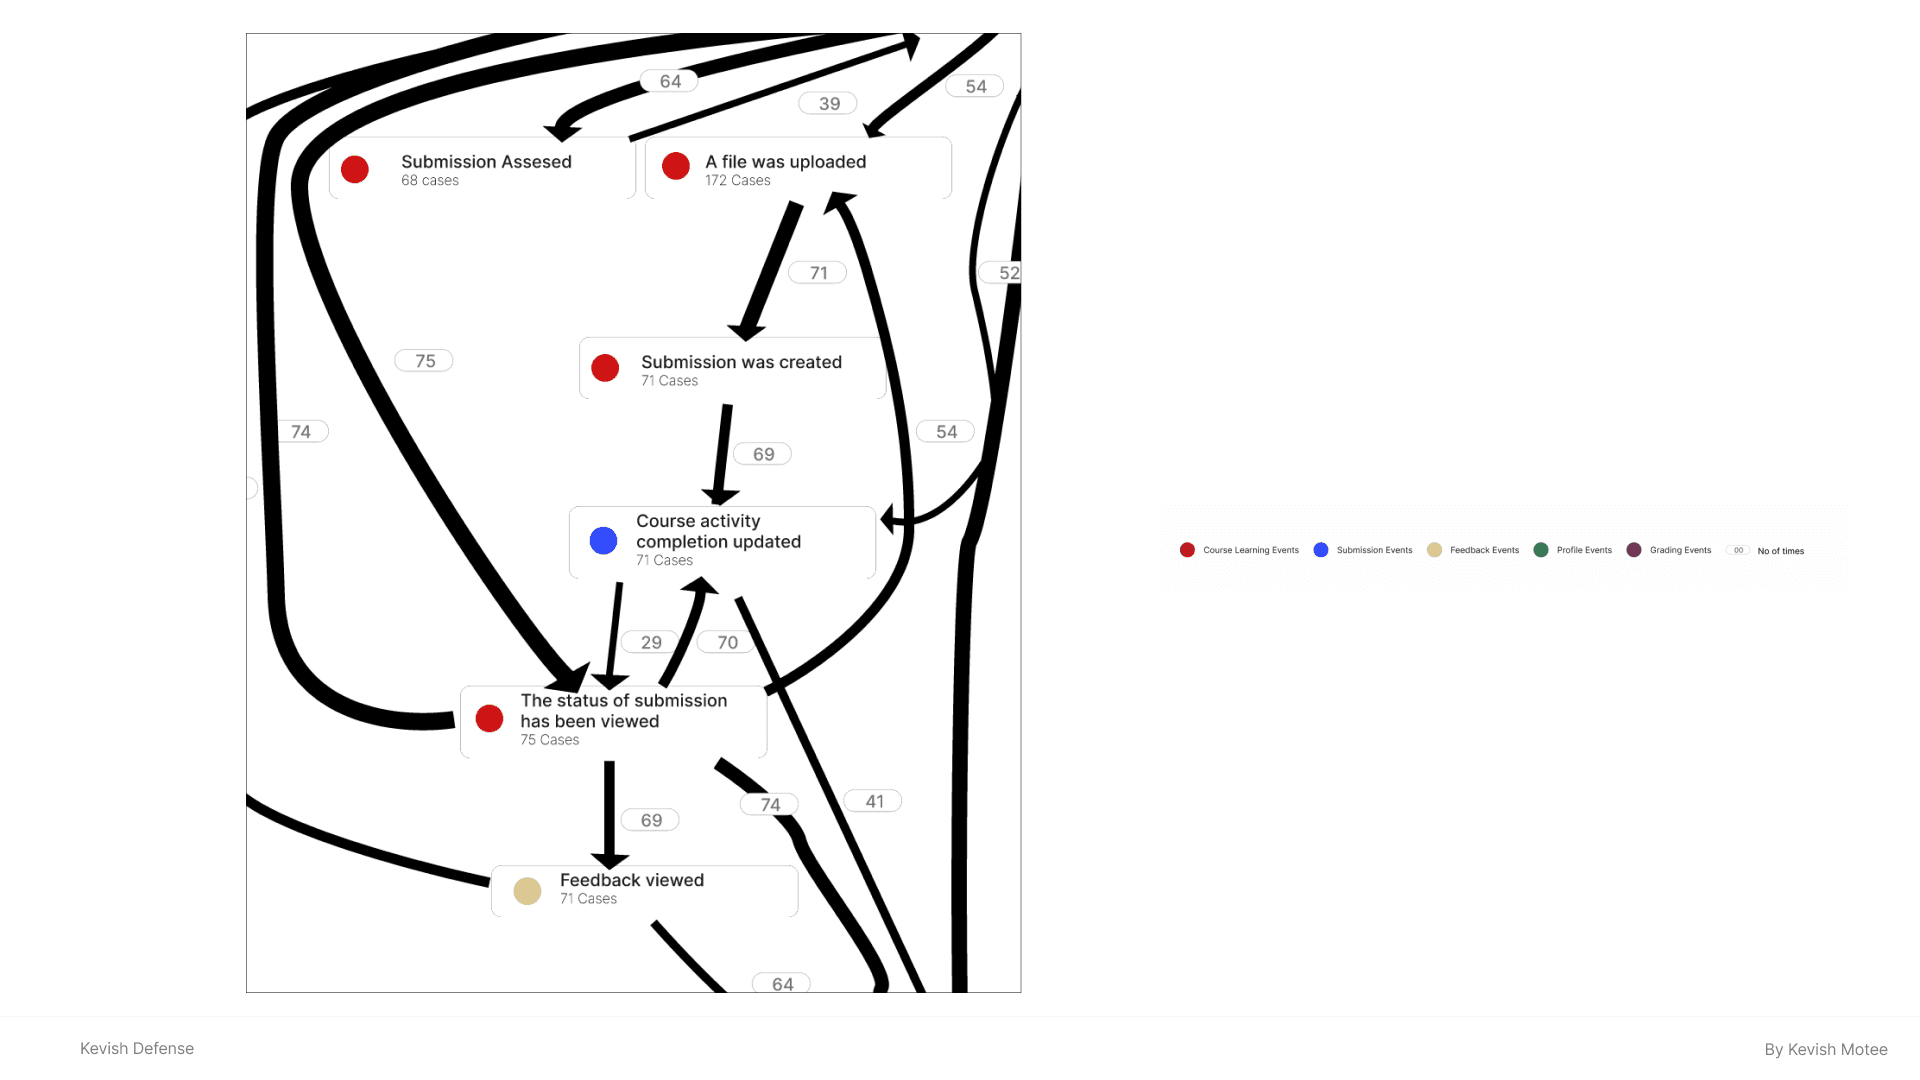
Click based interaction, which shows heatmaps to show interaction intensity, bar chart to show timestamps, scatter plot to differentiate between different types of activities withinsame event categories and line graph for activity with timestamps, and sankey chart for user flows
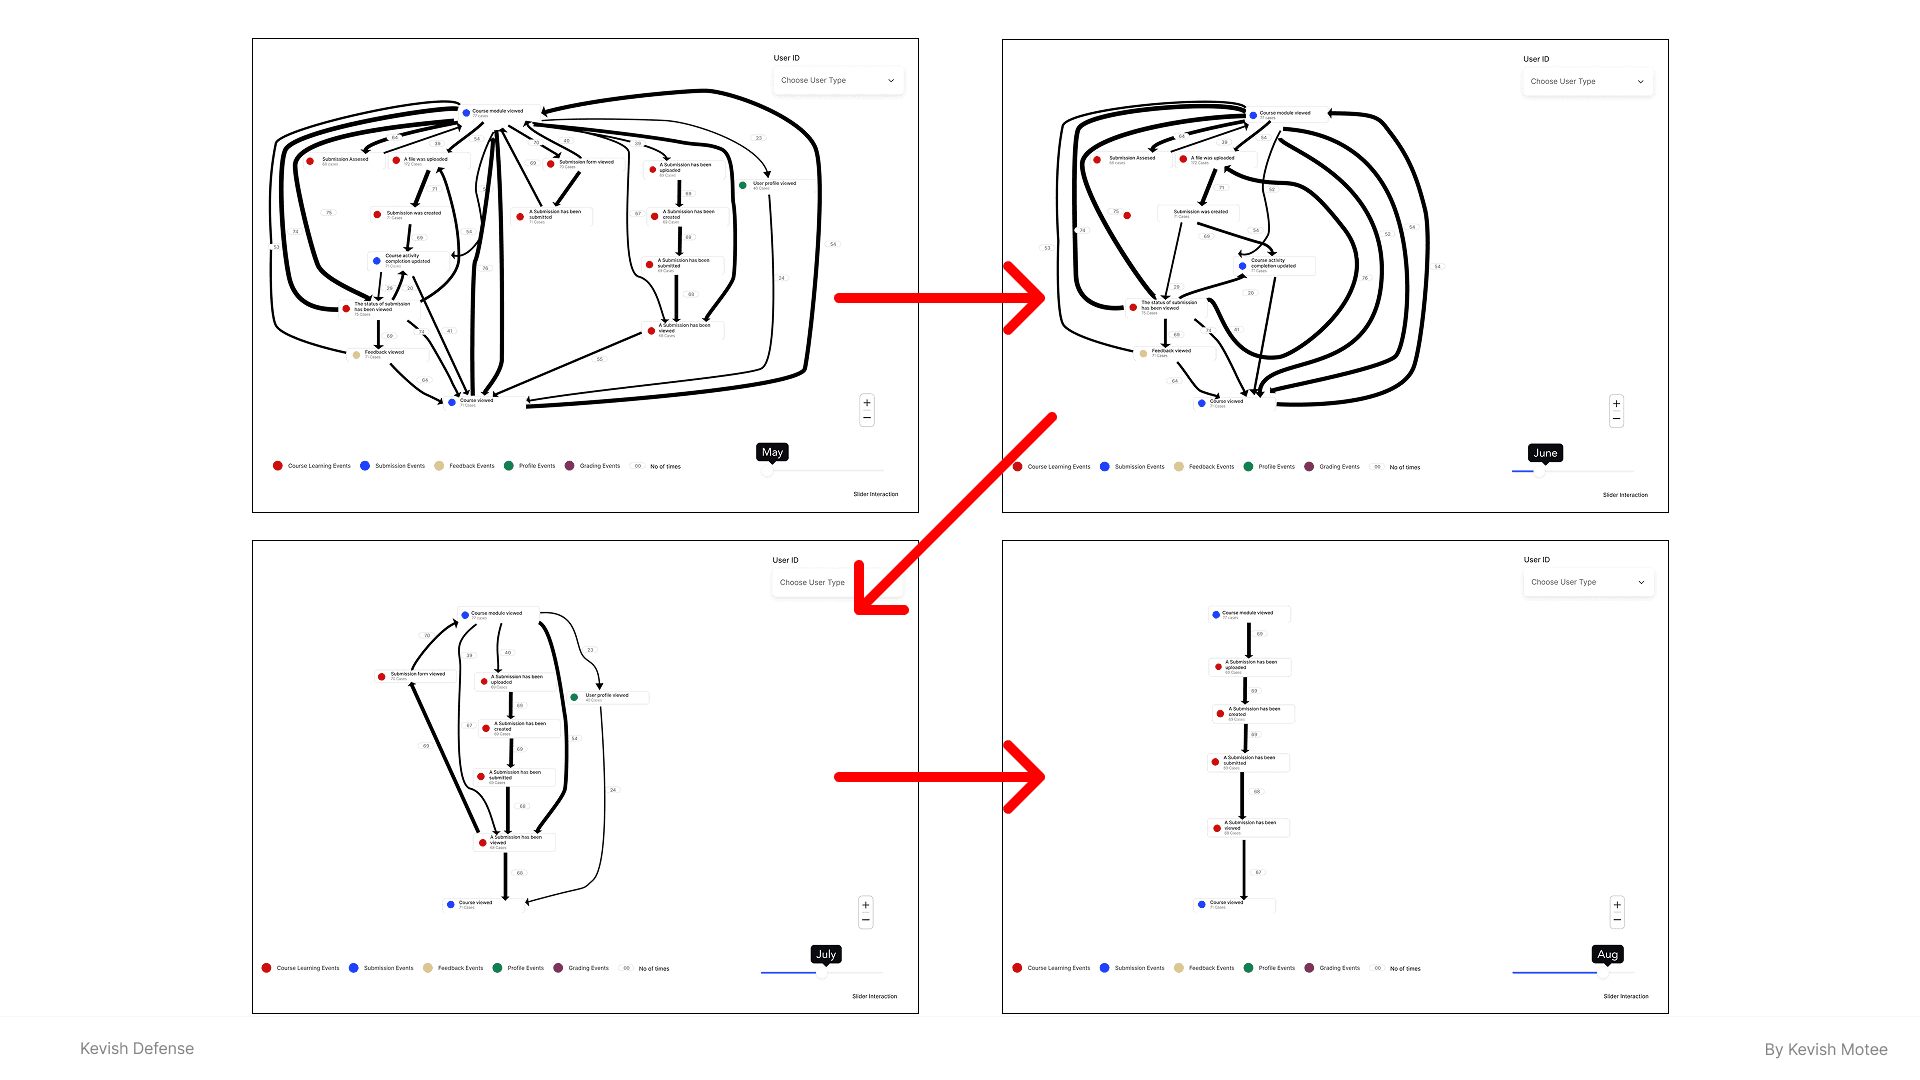
B. Sliders
Sliders, to move through the months of a semester,
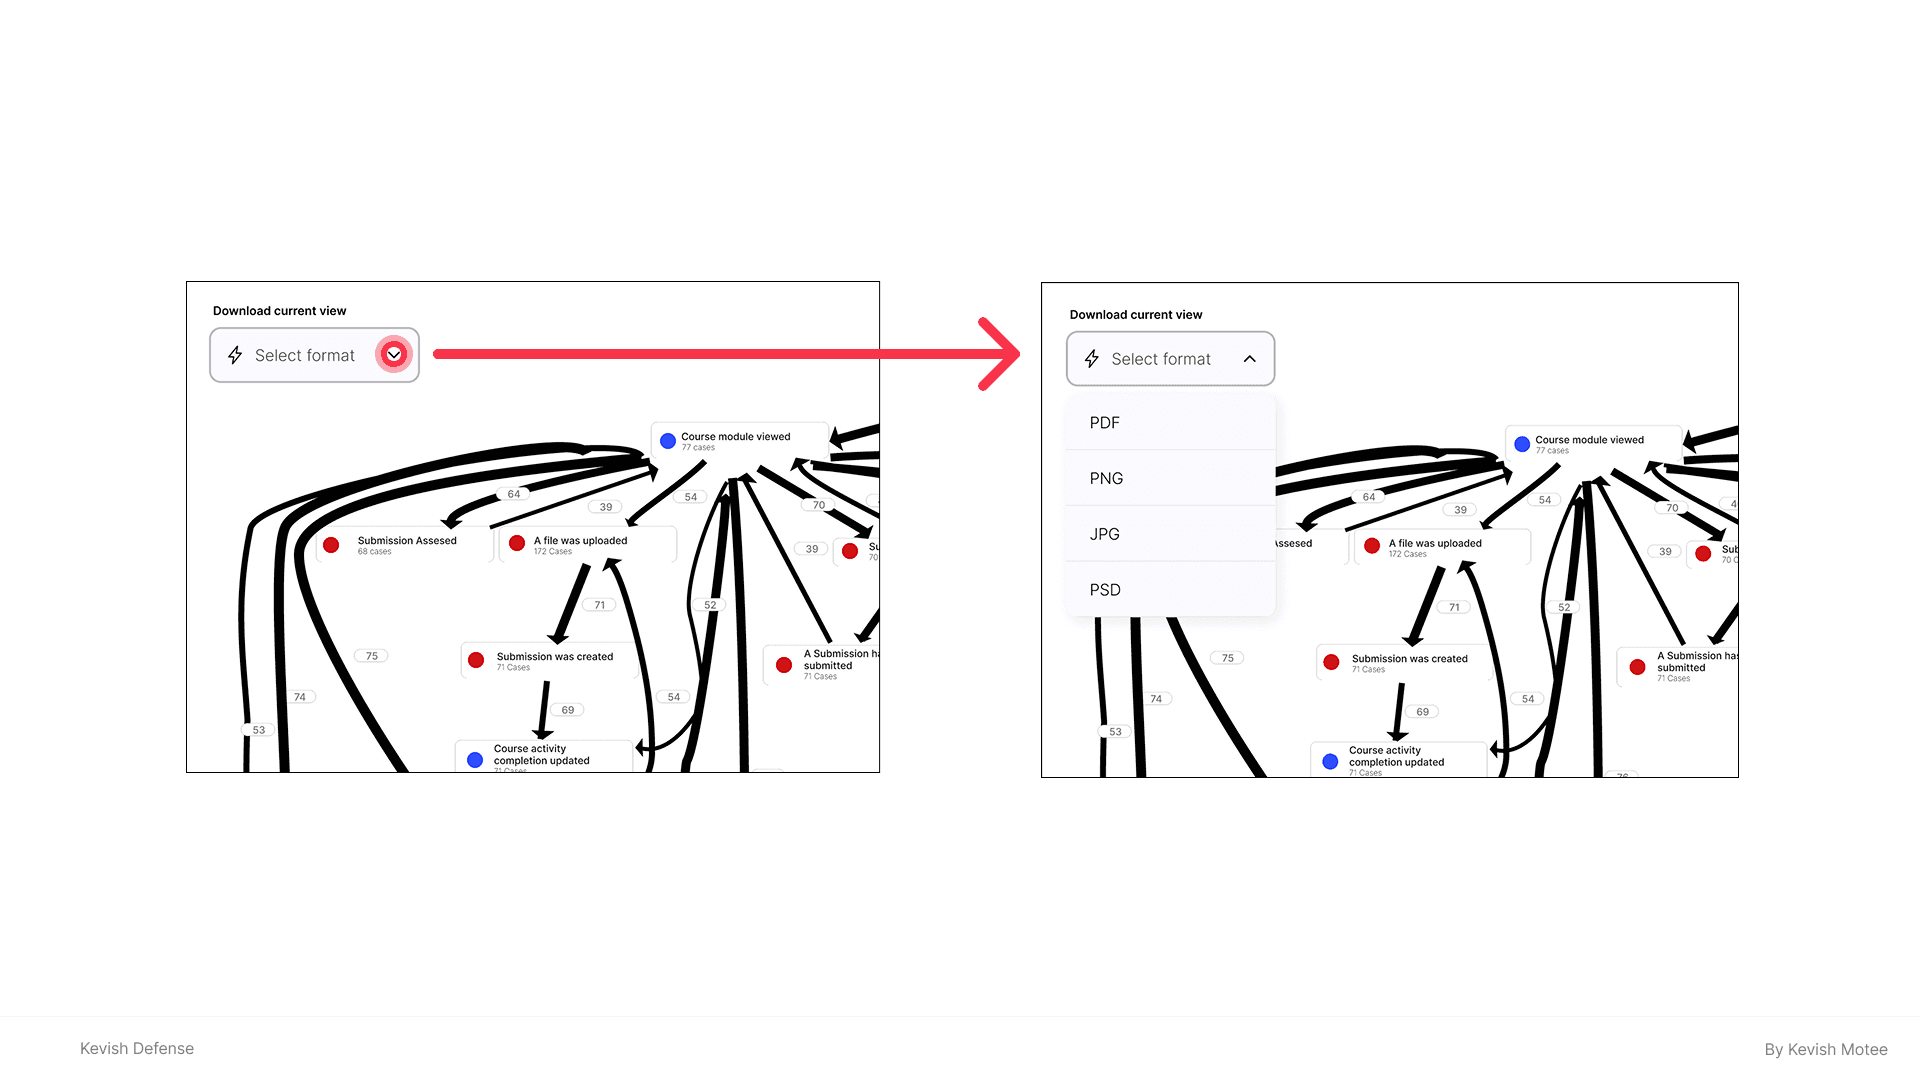
C. Dropdown to download current view
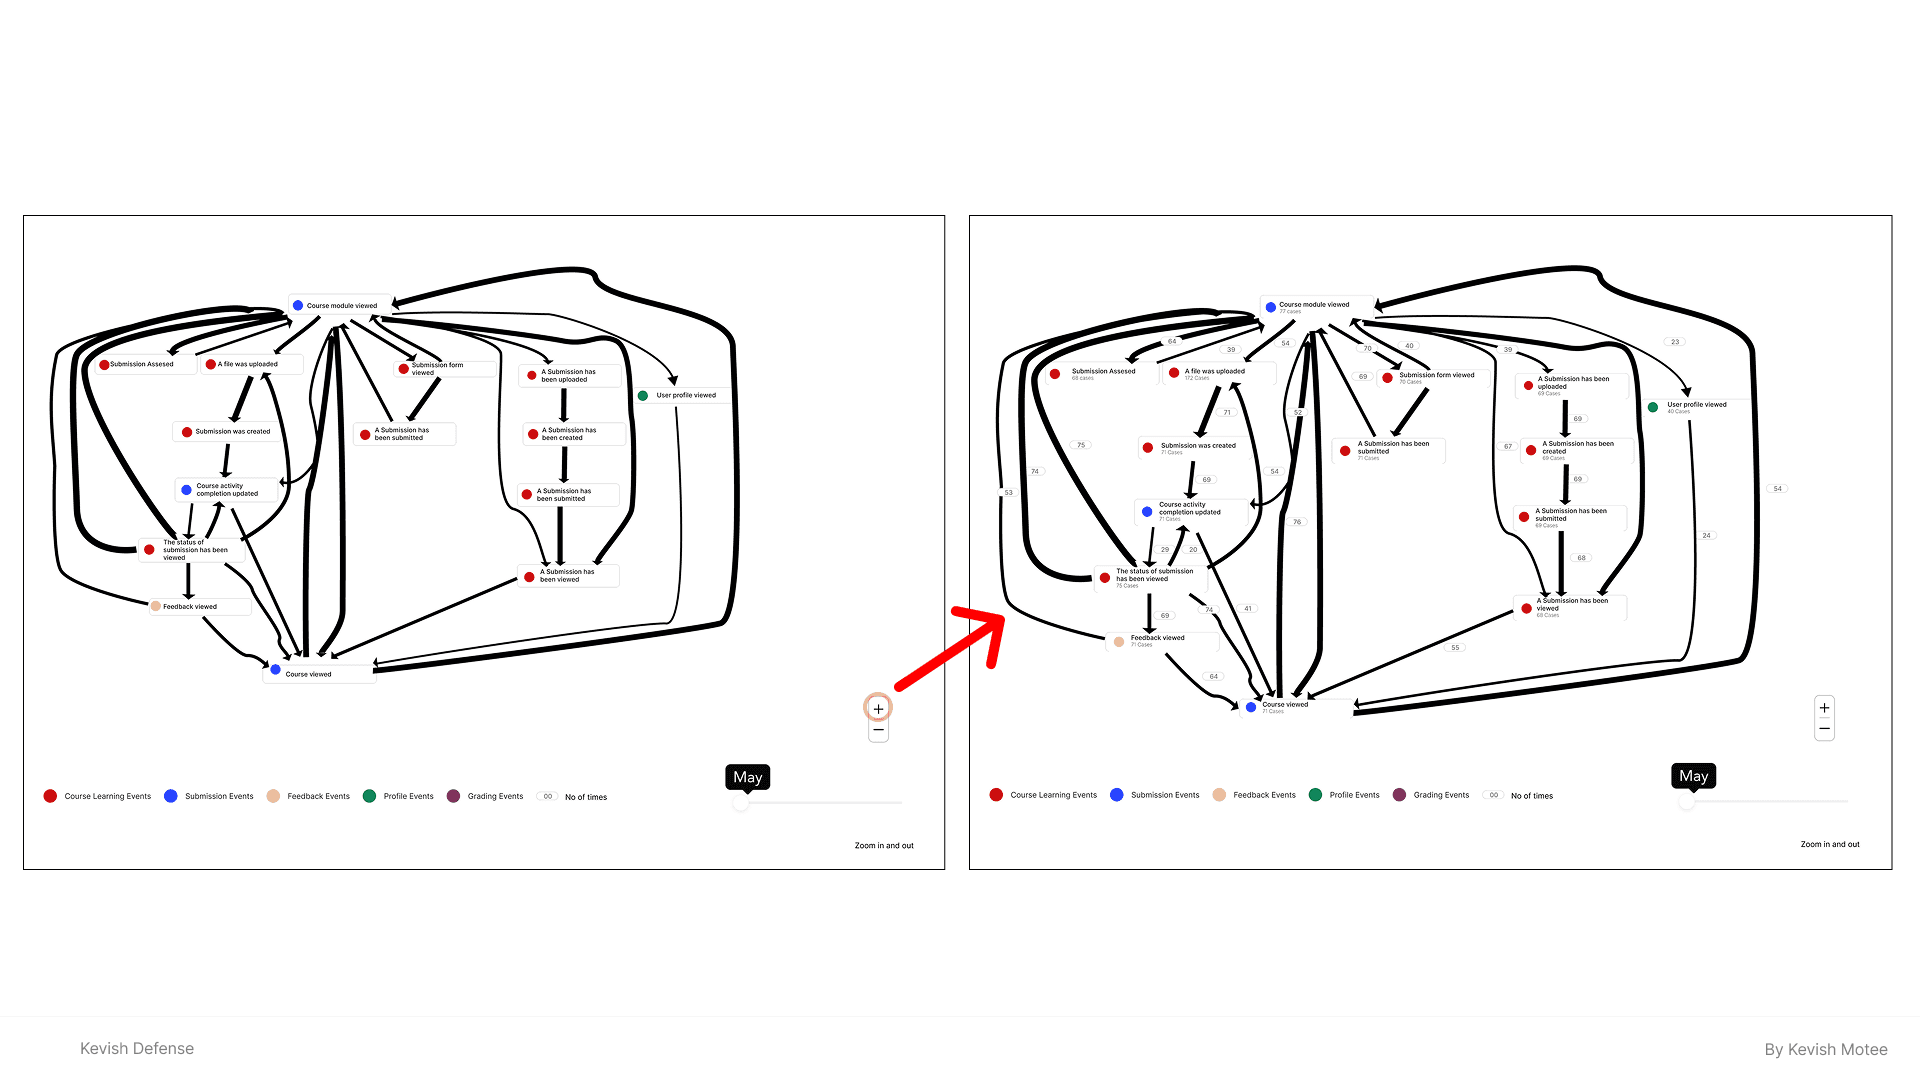
D. Zoom functionality
Zoom functionality for users to explore both high-level overviews and granular details
E. Colour Coding
Colour coded events based on category
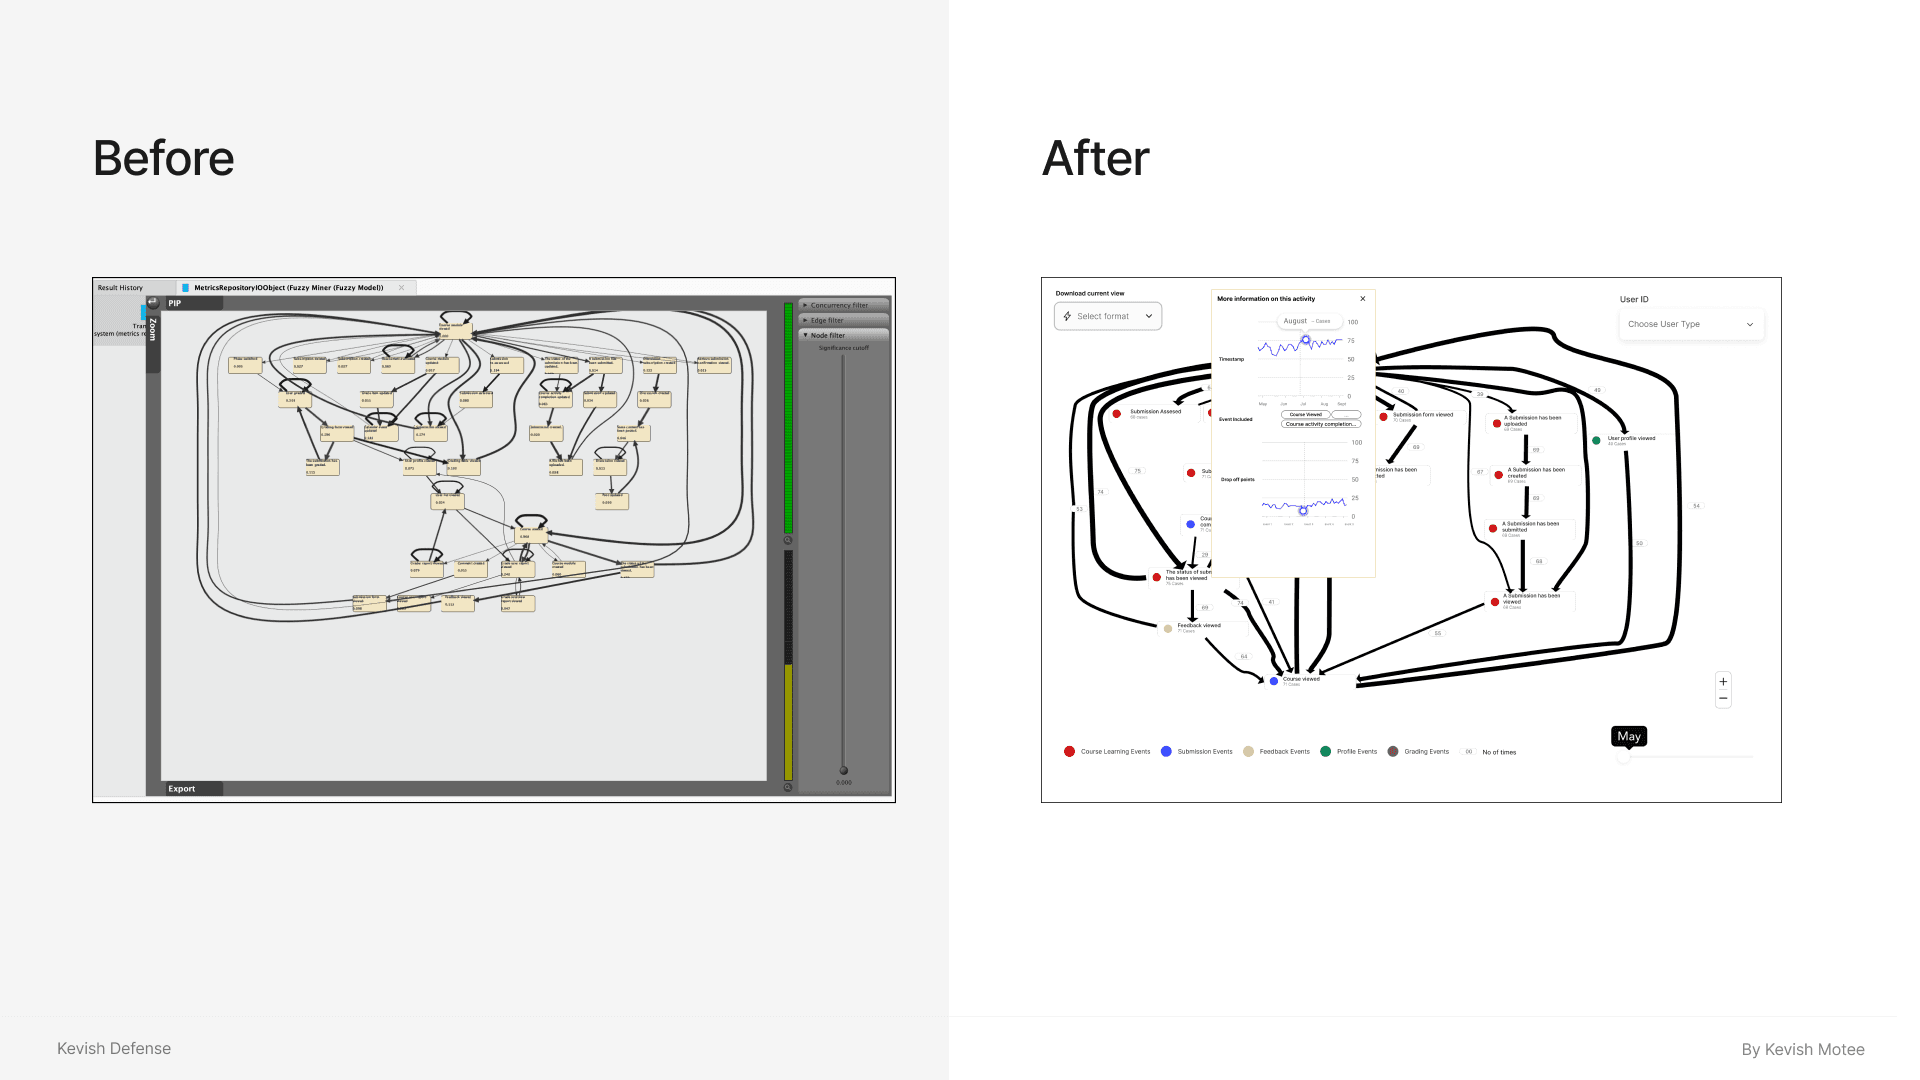
Comparison
The comparison of how the one visusalition looked previously, on RapidMiner and the proposed prototype visualisation
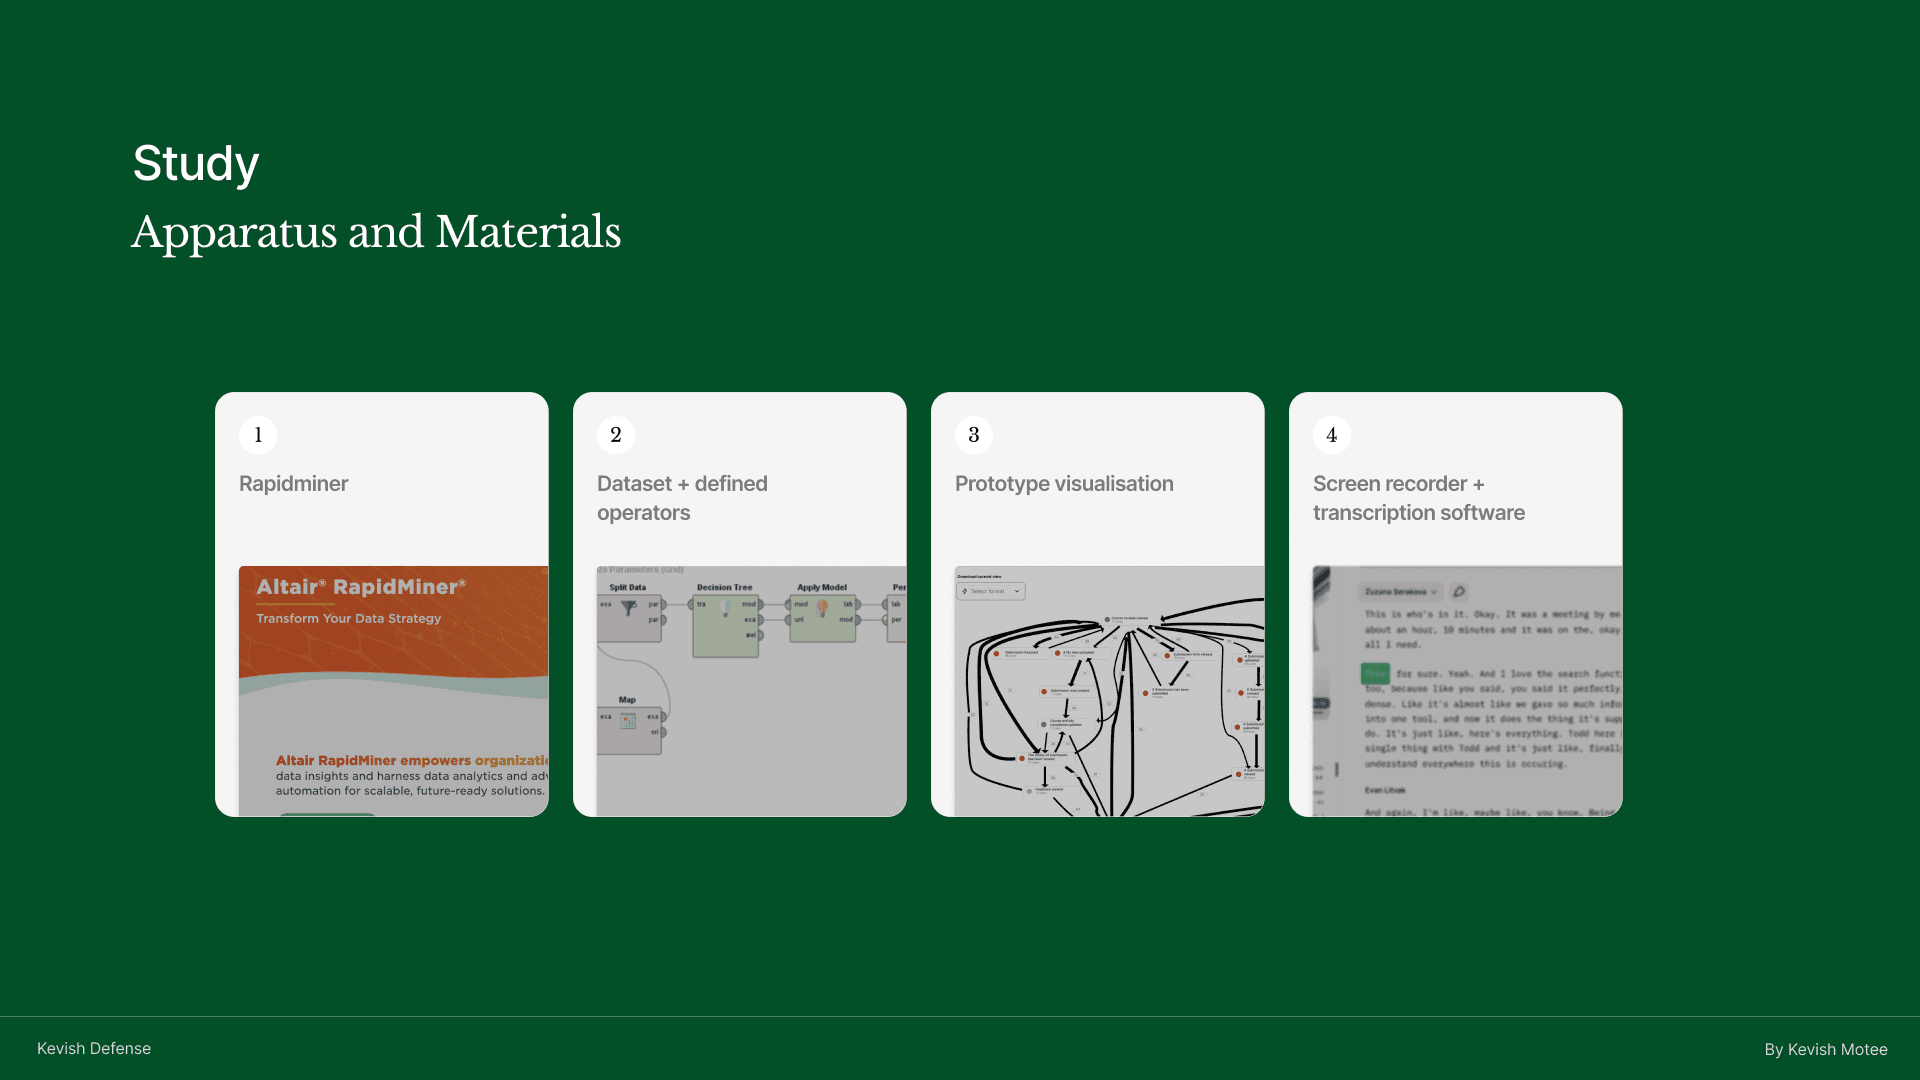
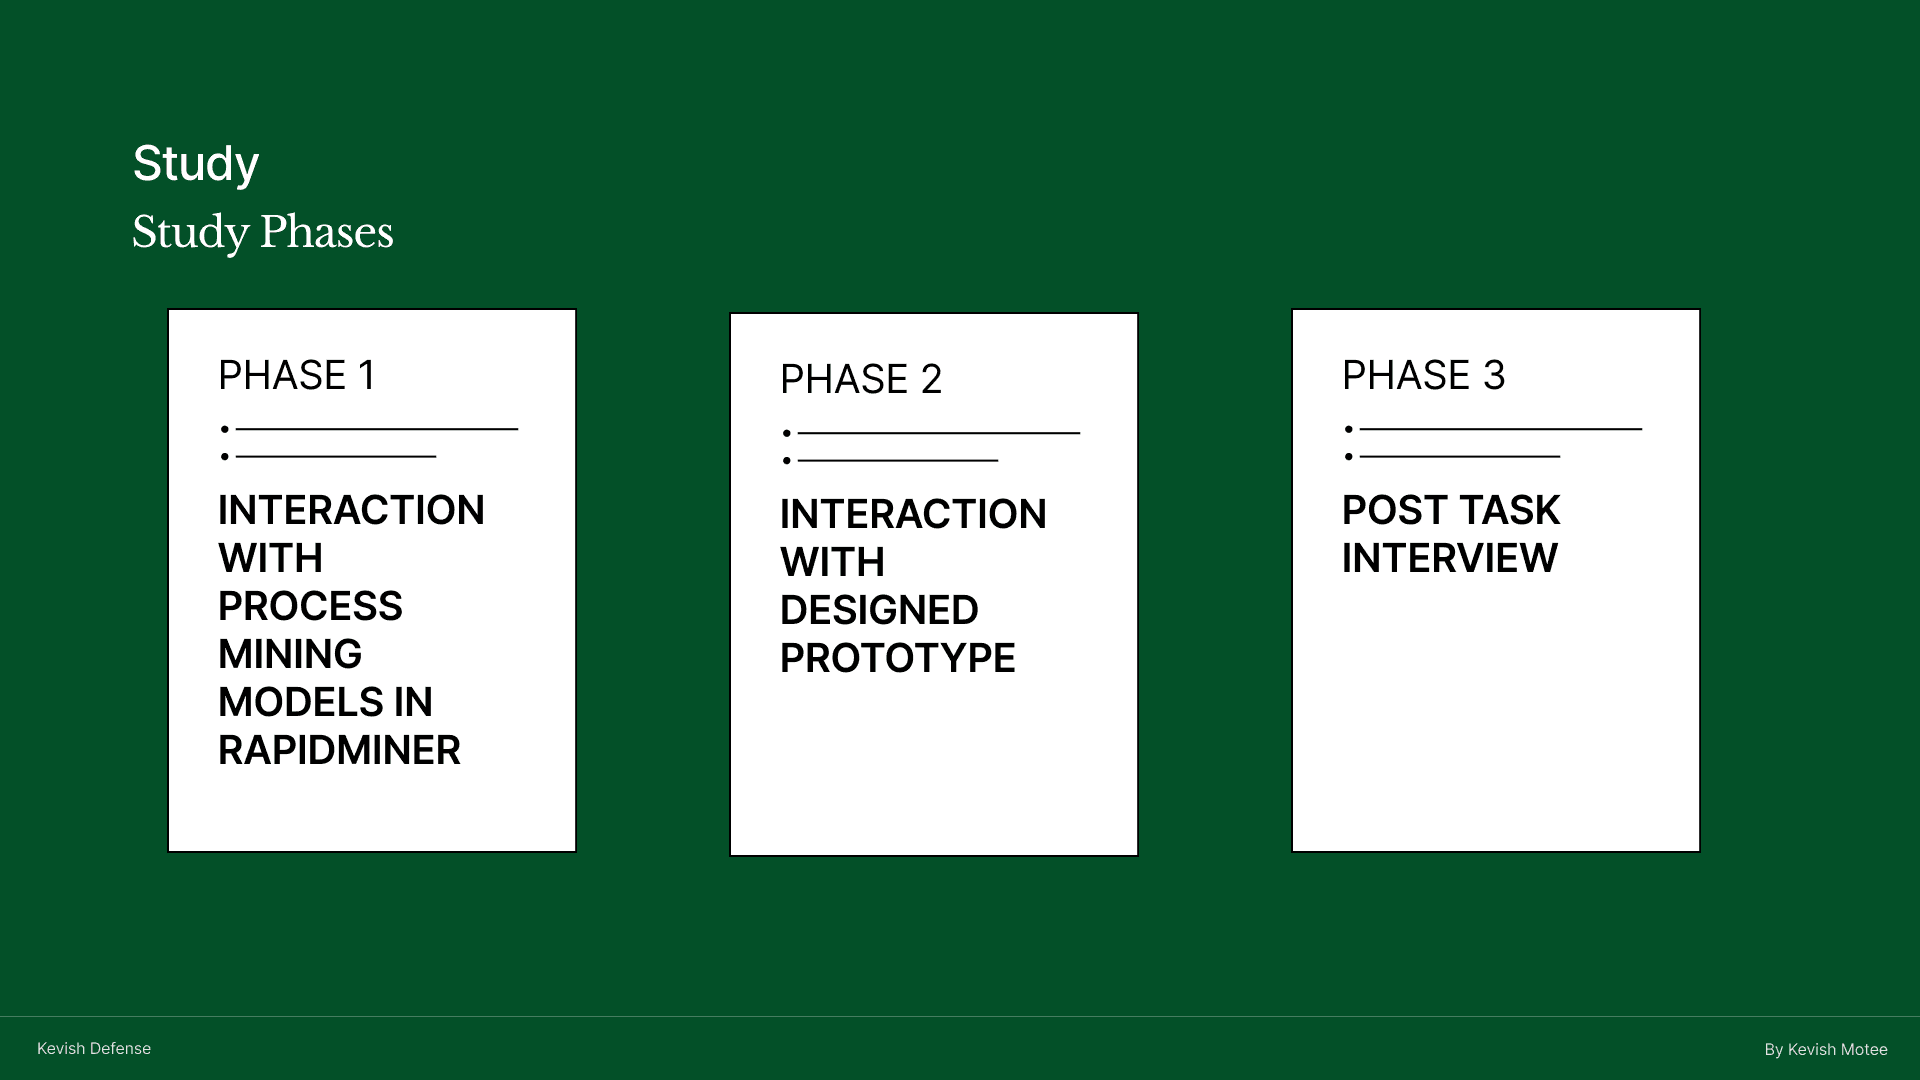
THE STUDY
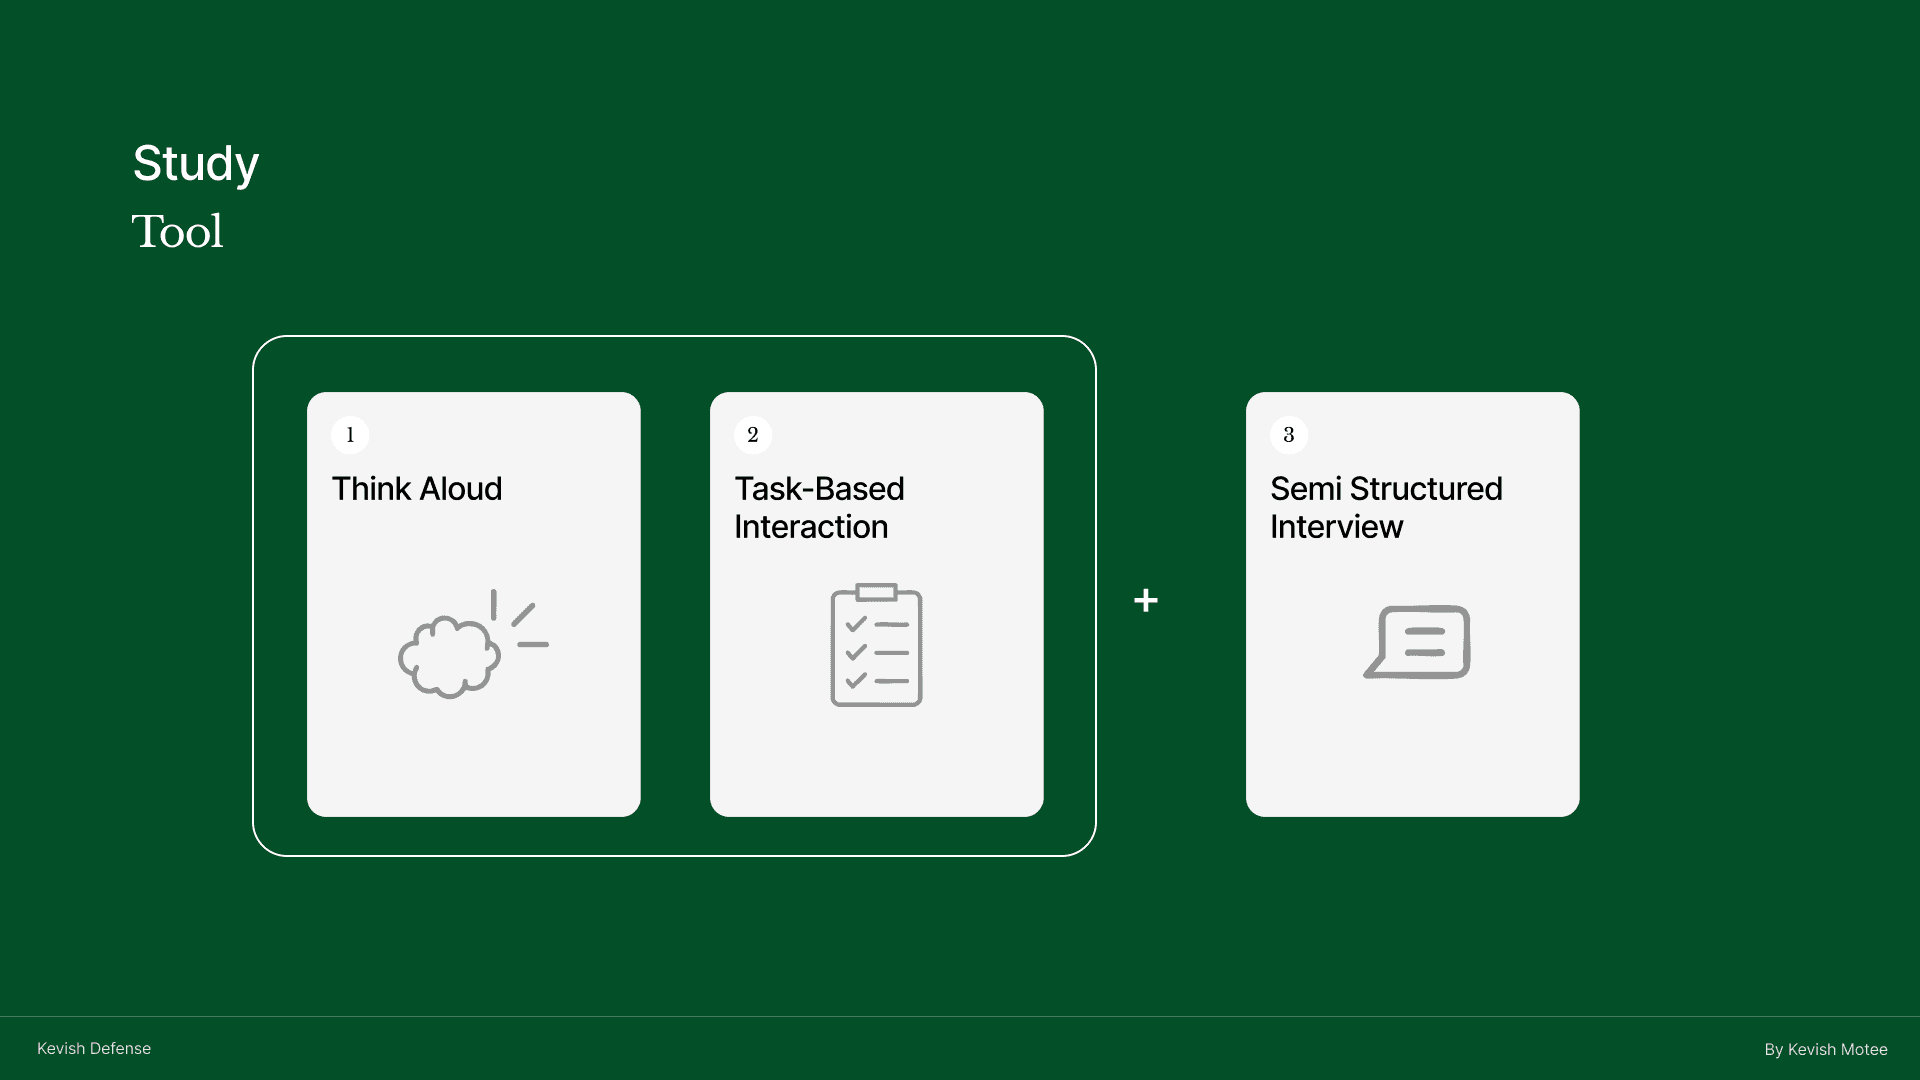
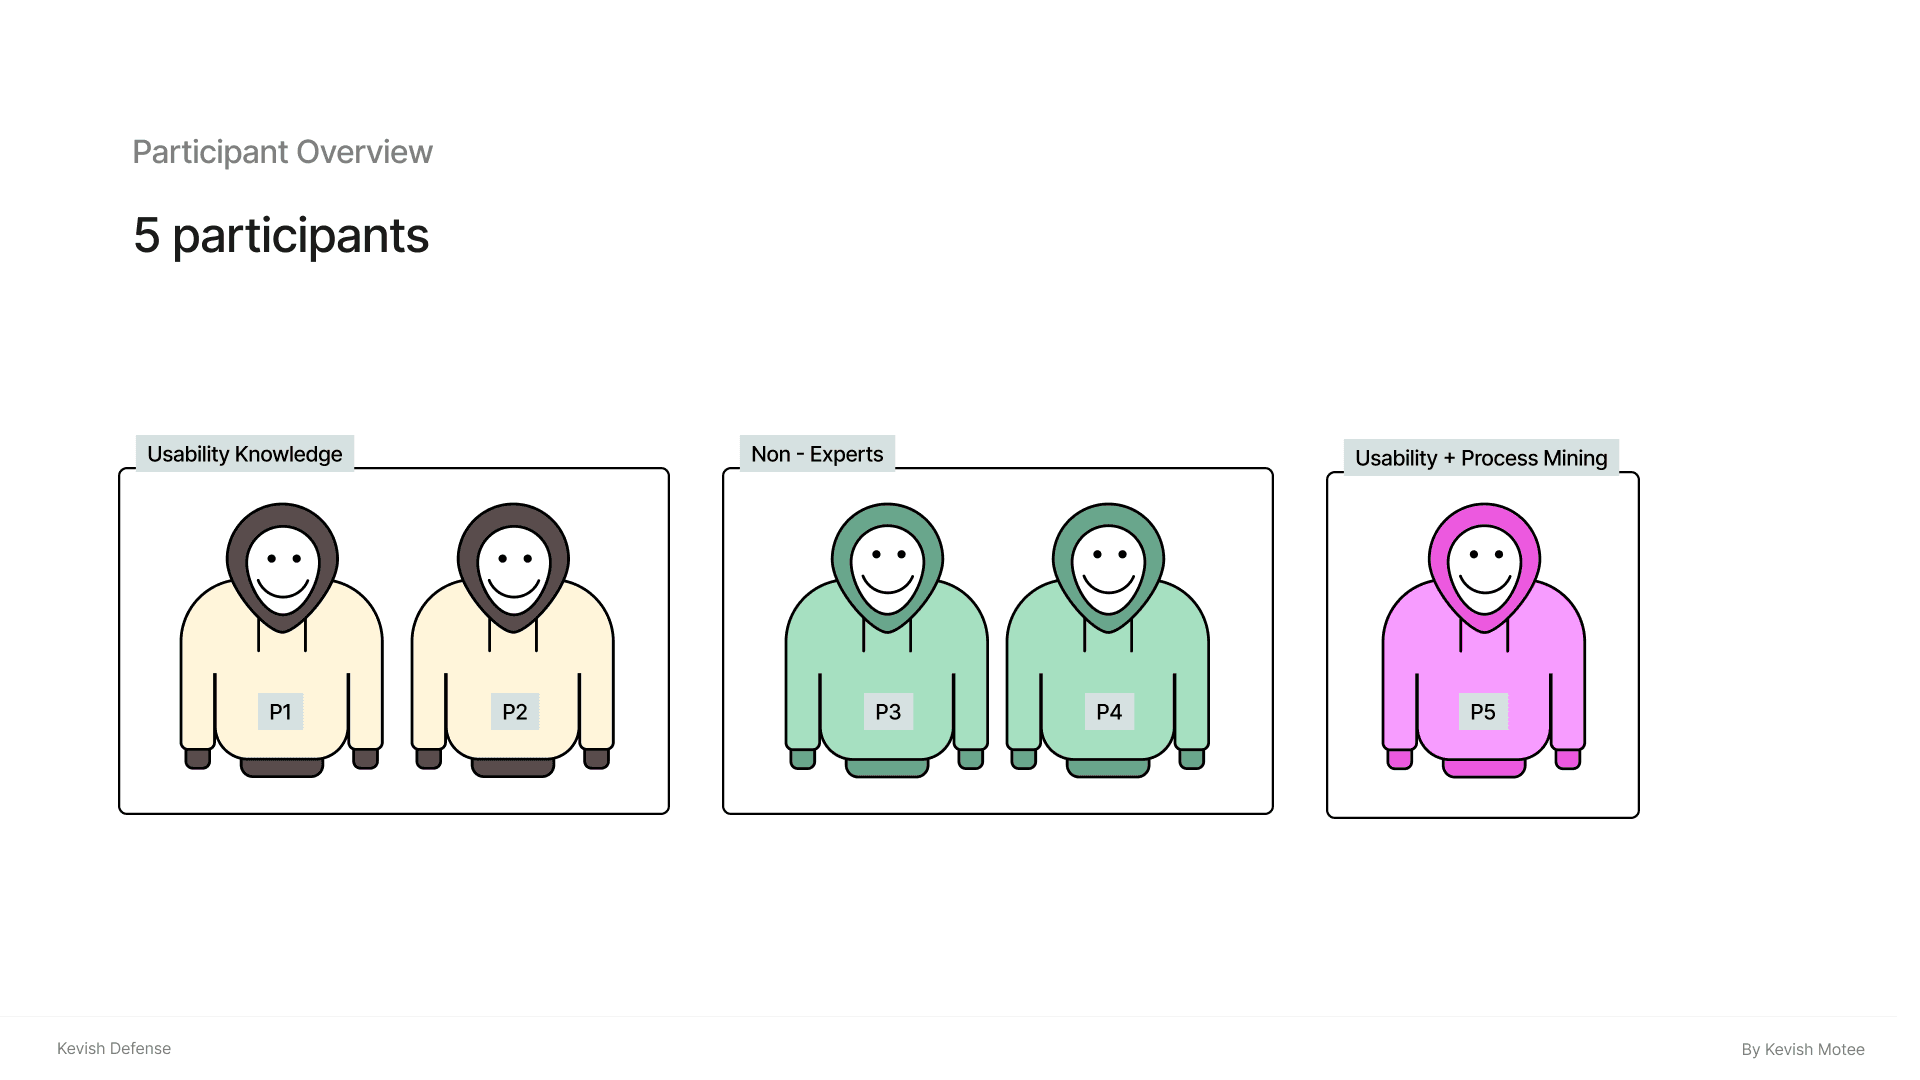
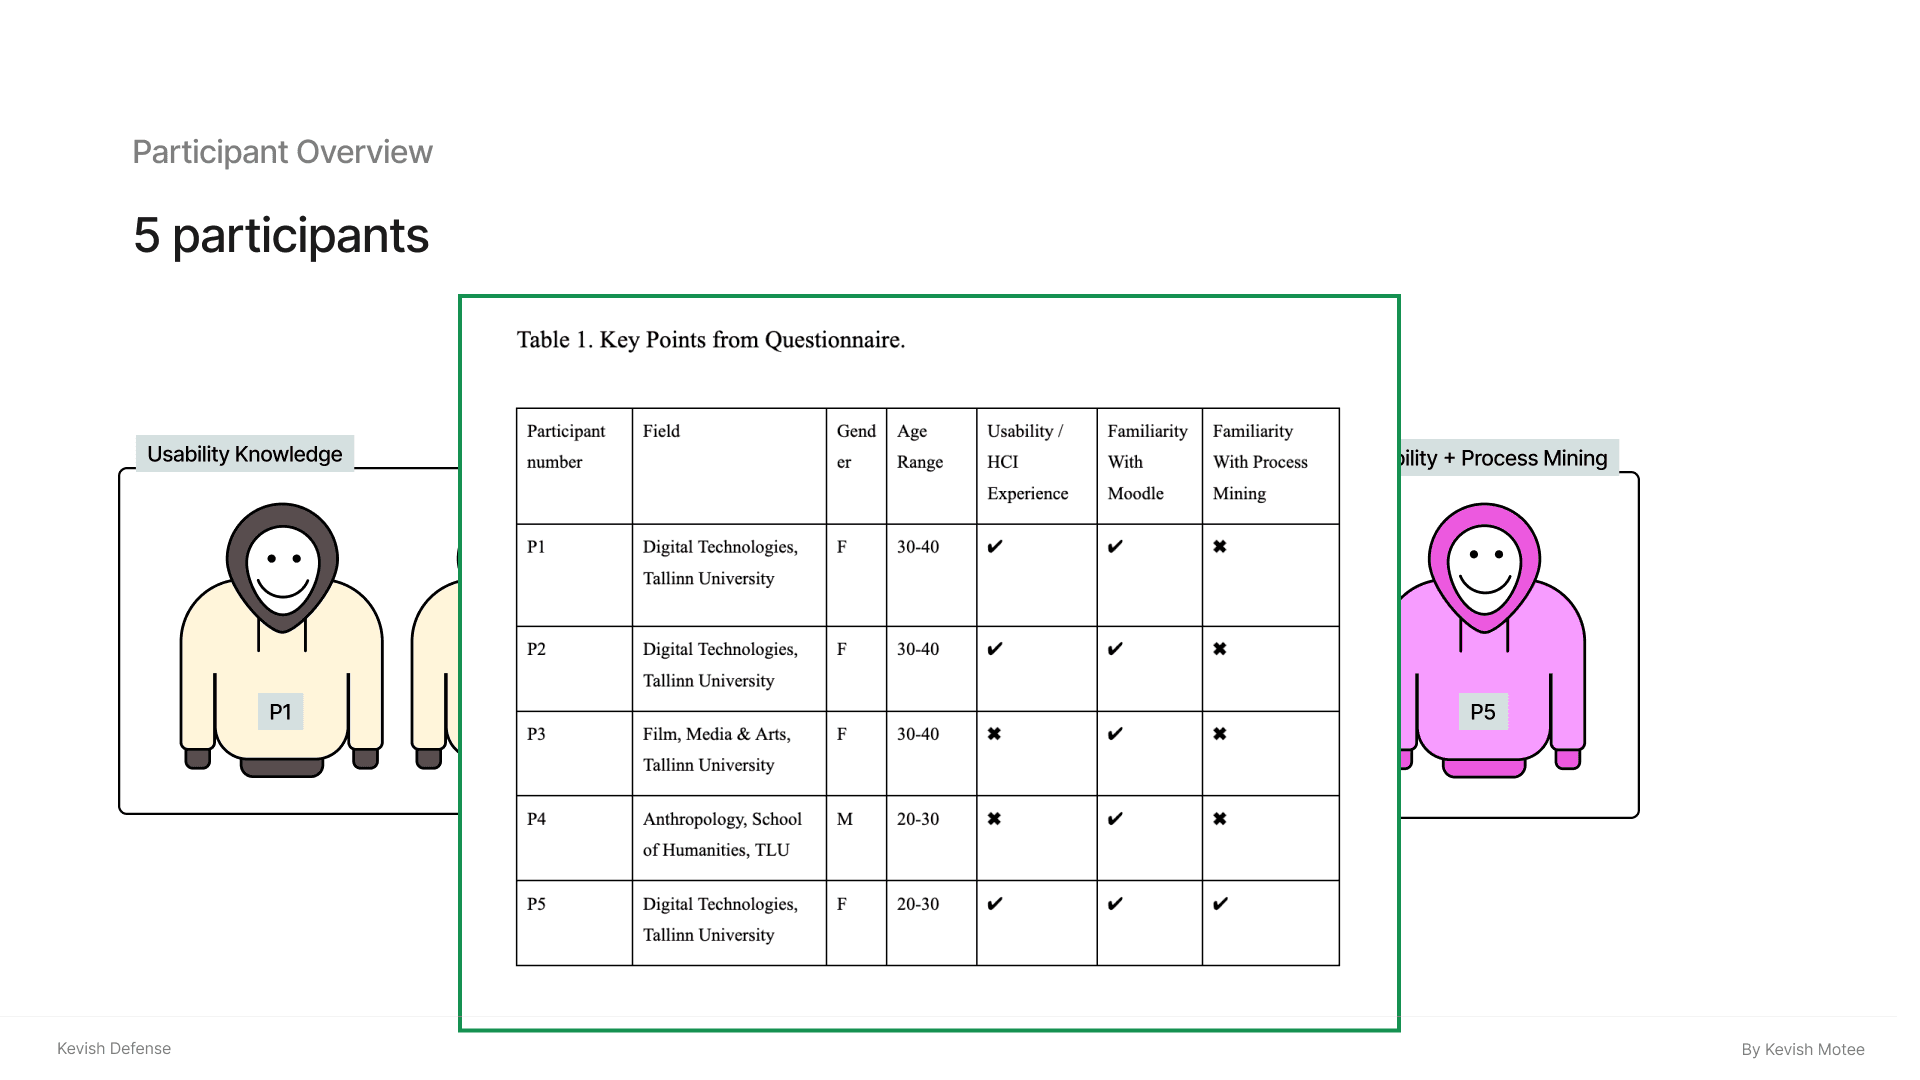
Questionnaire
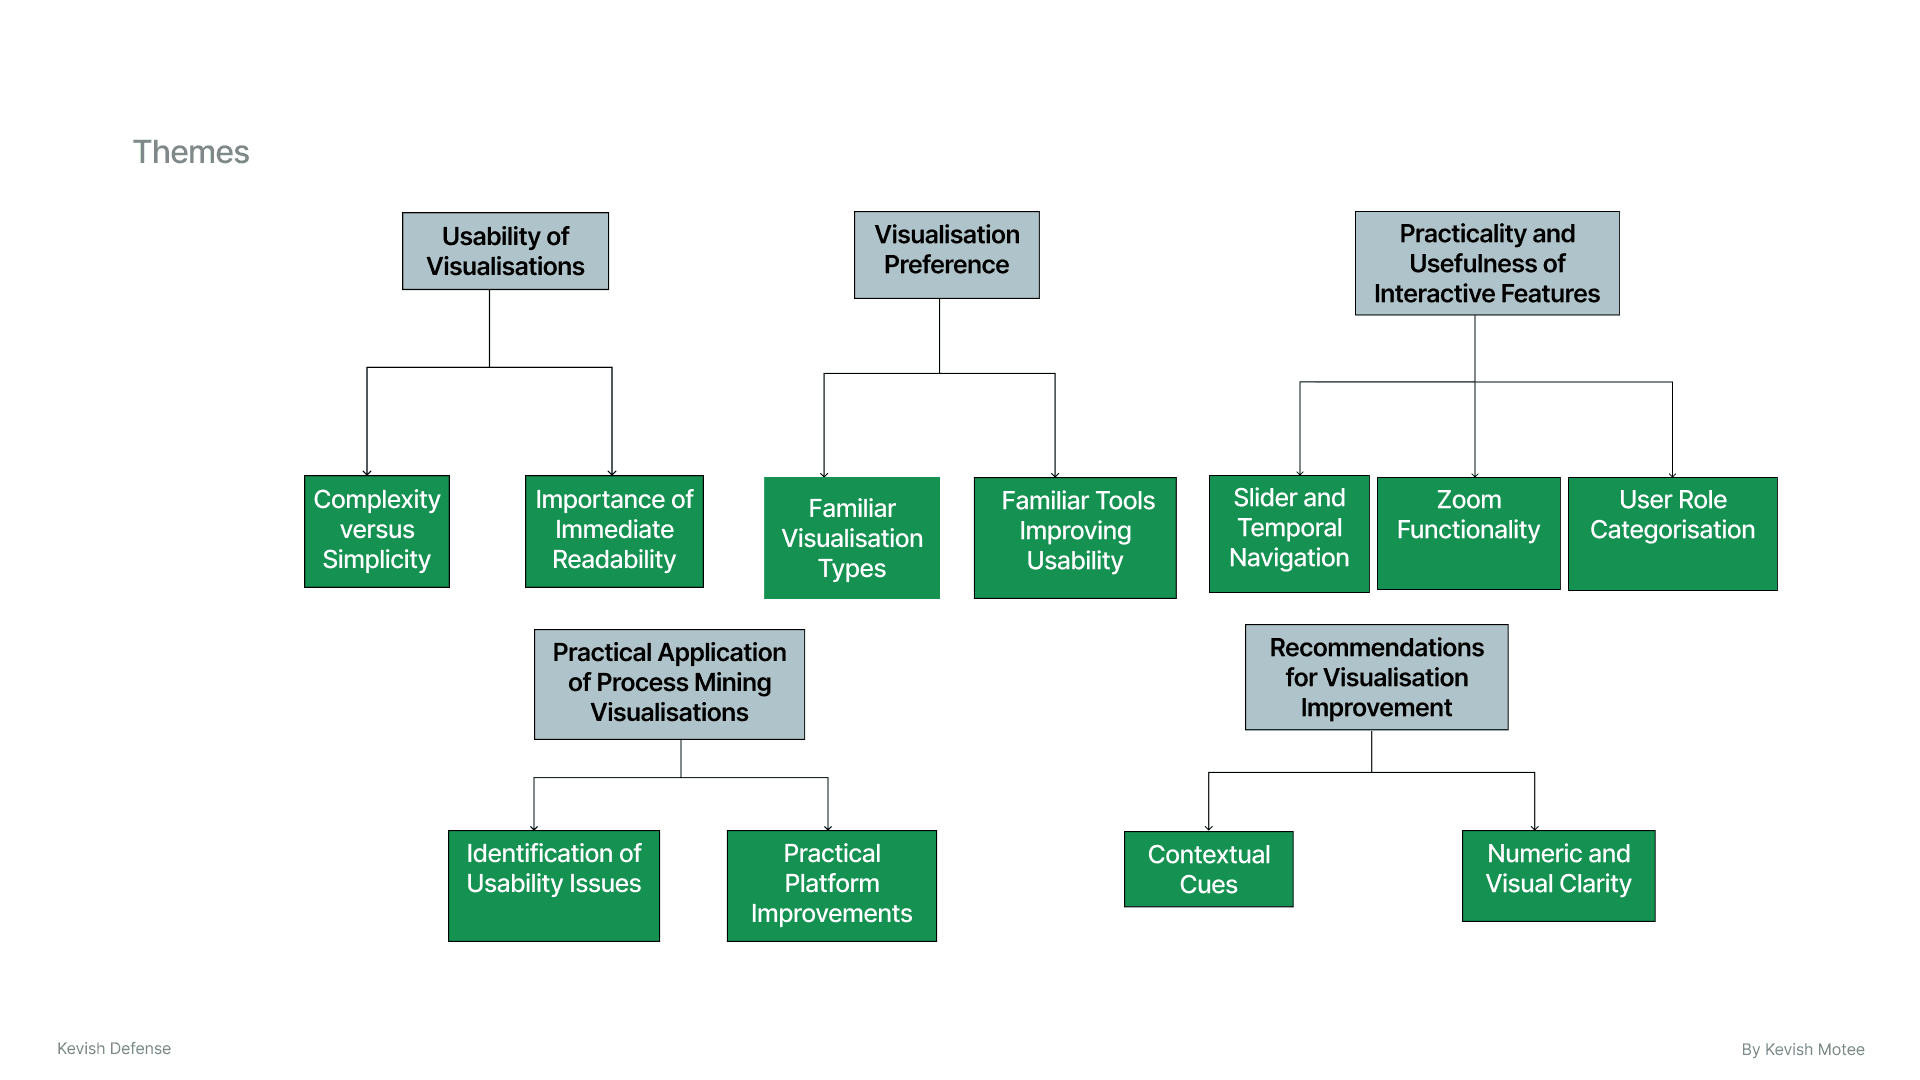
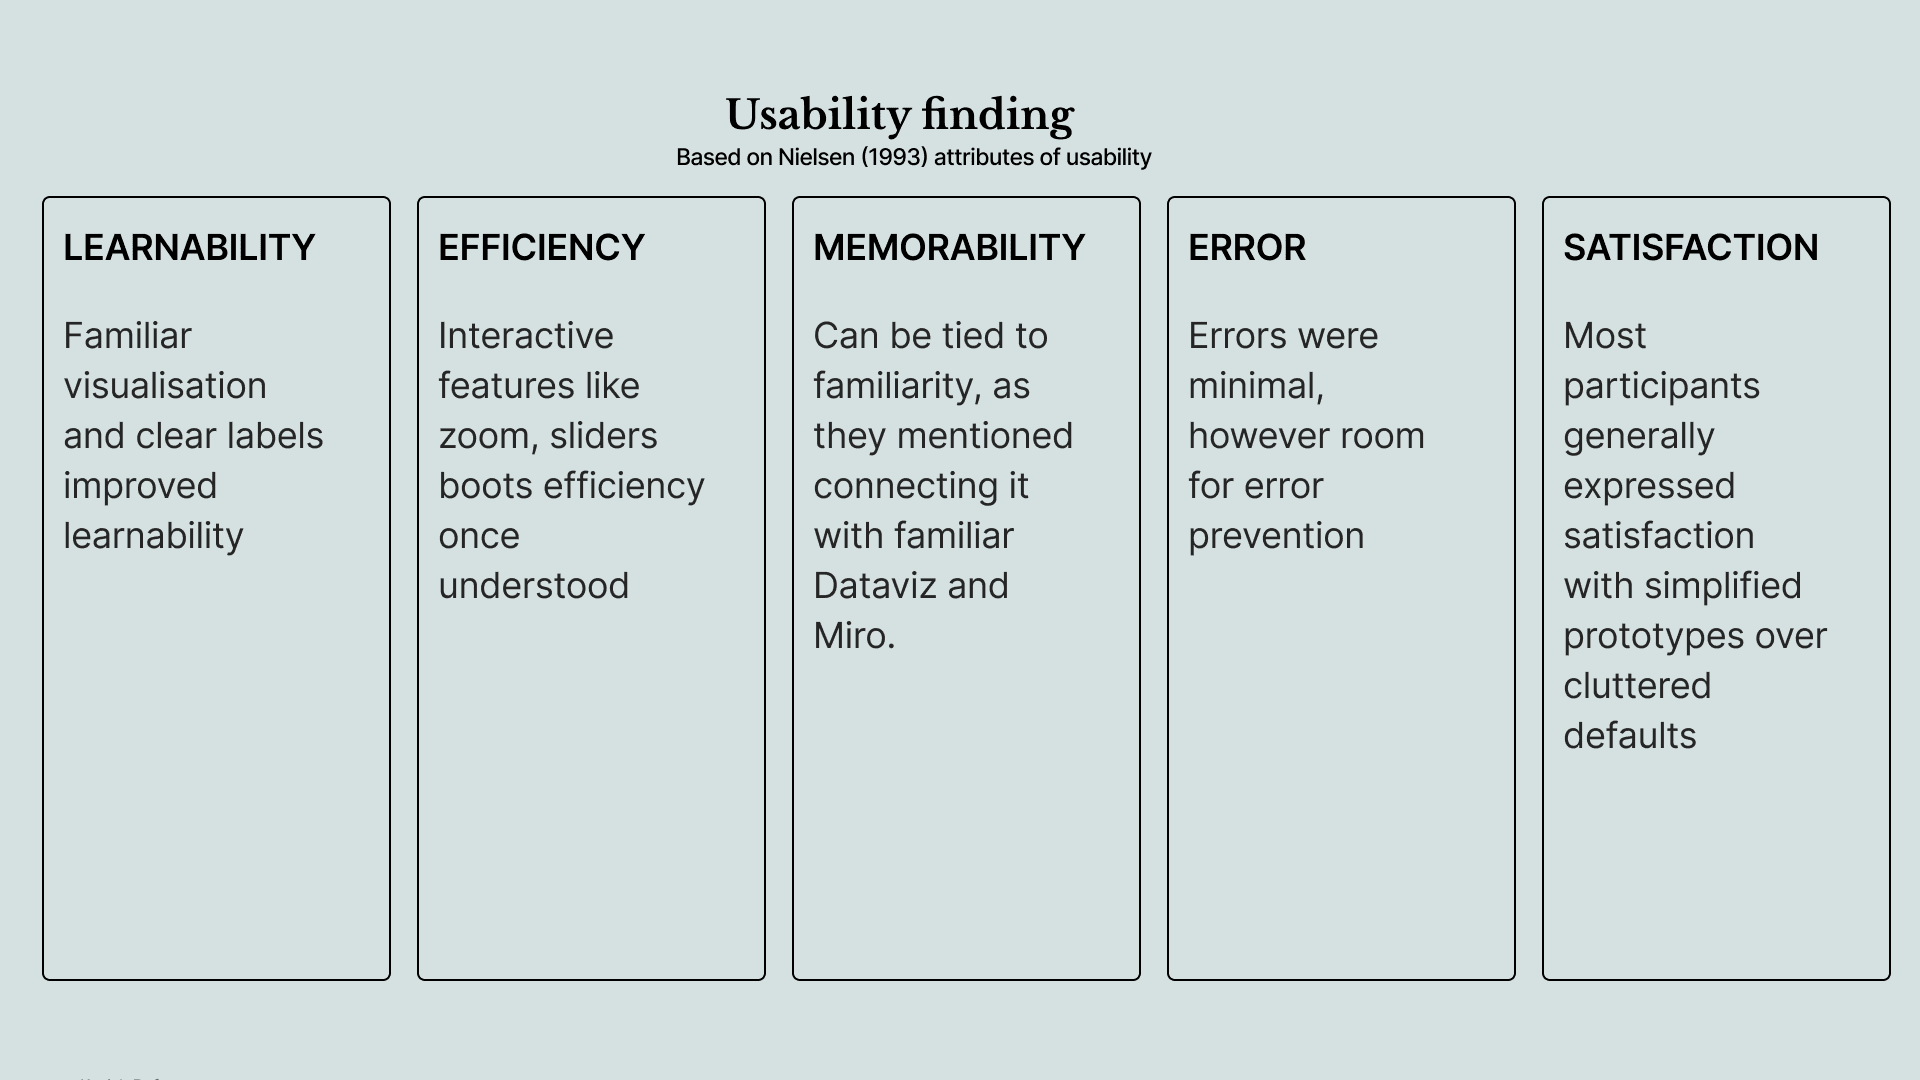
THEMATIC ANALYSIS